0Comments Off on Agriculture KPI Dashboard in Excel
The Agriculture KPI Dashboard in Excel is a fully customizable and ready-to-use template designed to streamline the monitoring of key performance indicators (KPIs) within the agricultural sector. From tracking energy usage to crop yield, this dashboard helps you efficiently monitor and manage both agricultural and energy KPIs in one centralized location Agriculture KPI Dashboard in Excel.
Key Features:
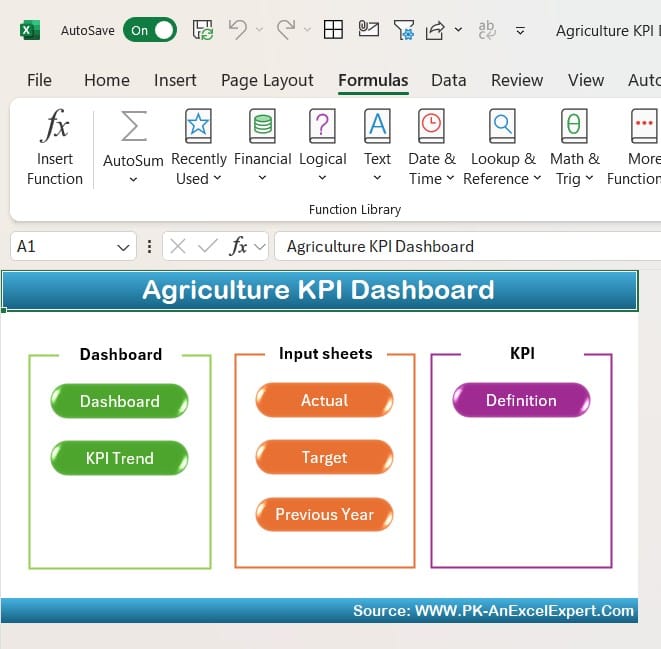
Home Sheet:
Home Sheet
A user-friendly index page with six buttons for easy navigation to each worksheet.
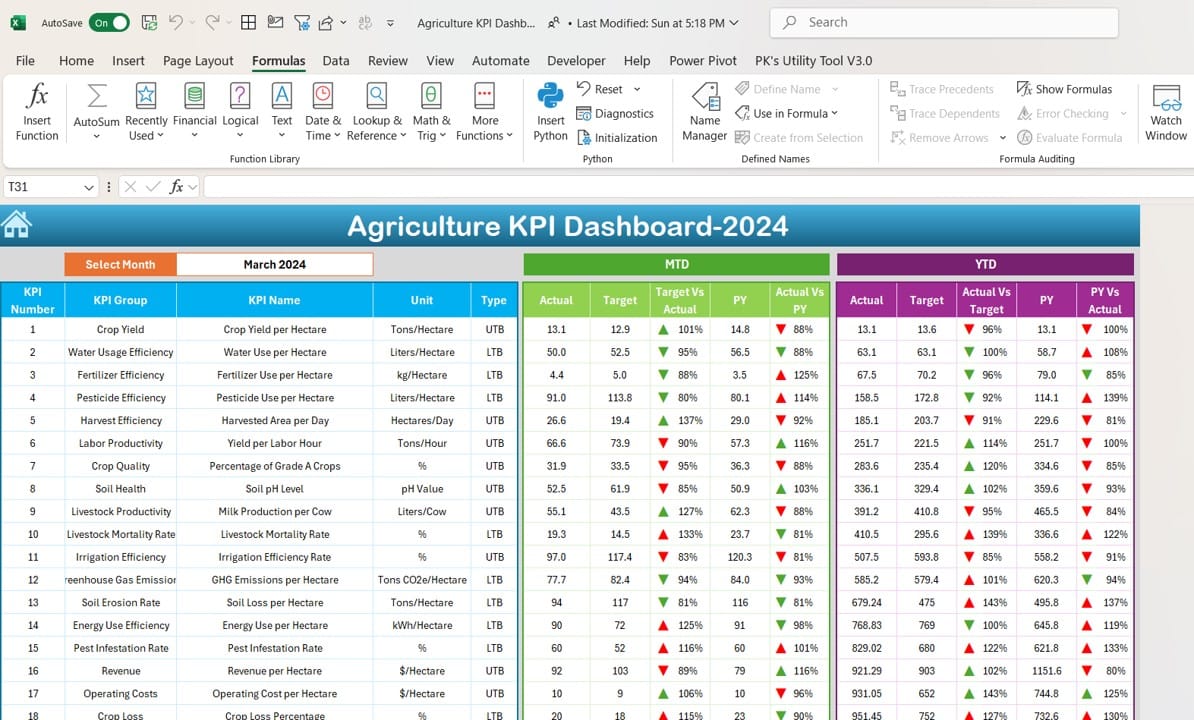
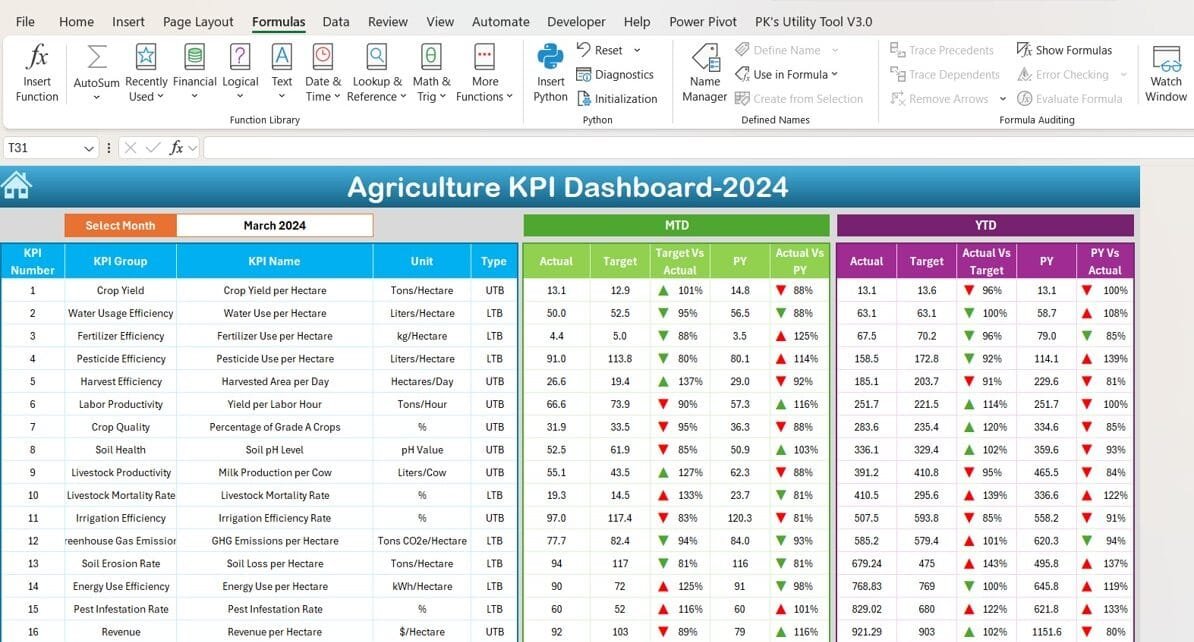
Dashboard Sheet Tab:
Agriculture KPI Dashboard in Excel
Displays MTD and YTD performance, with dynamic updates based on month selection and real-time conditional formatting for quick insights.
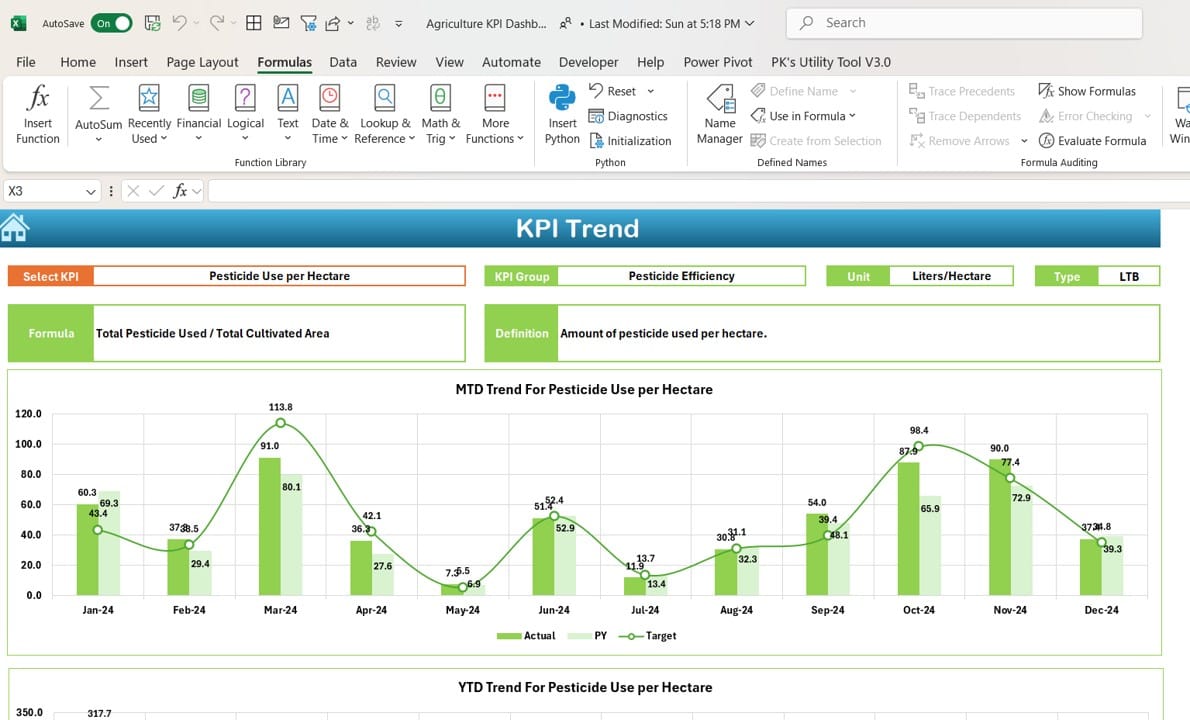
KPI Trend Sheet Tab:
KPI Trend Sheet
Provides in-depth KPI trend analysis with charts, formulas, and definitions for each KPI.
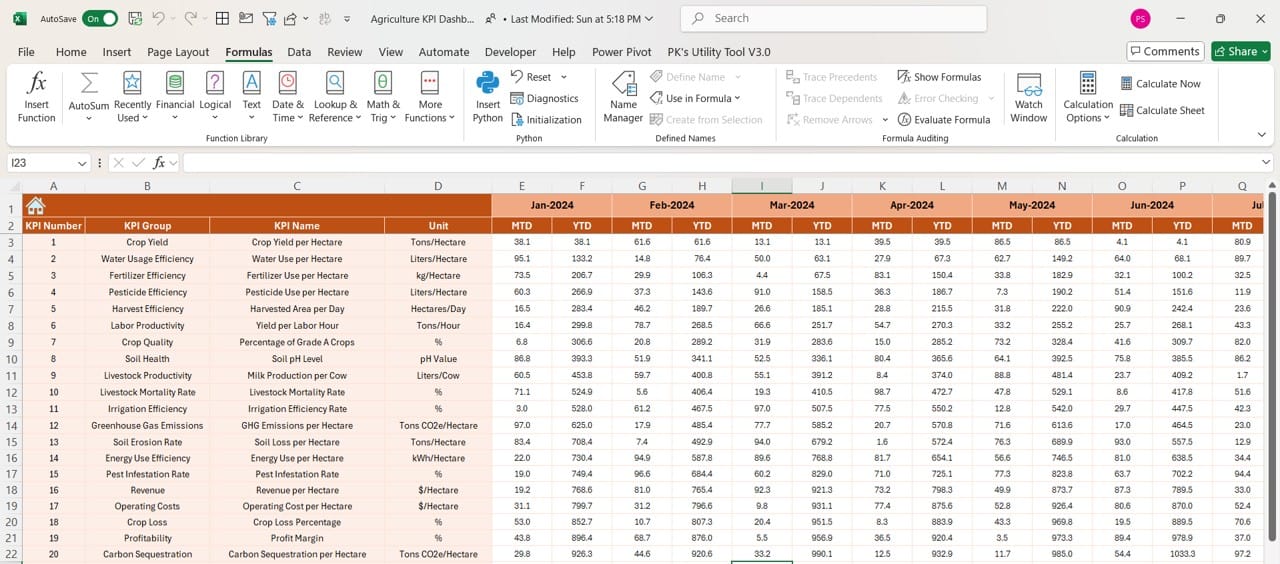
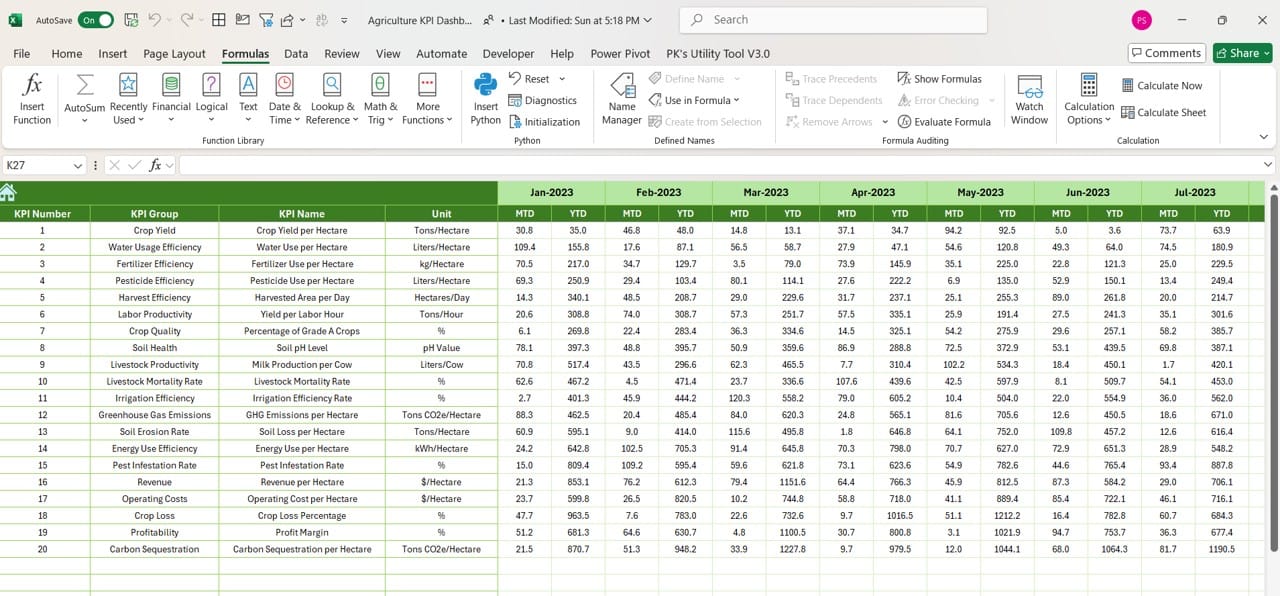
Actual Numbers Input Sheet:
Actual Numbers Input Sheet
Allows users to input MTD and YTD actual numbers for each month, enabling precise tracking of performance.
Target and Previous Year Sheets:
Previous Year Sheets
Enables goal-setting and comparative analysis by entering target and prior year’s data for each KPI.
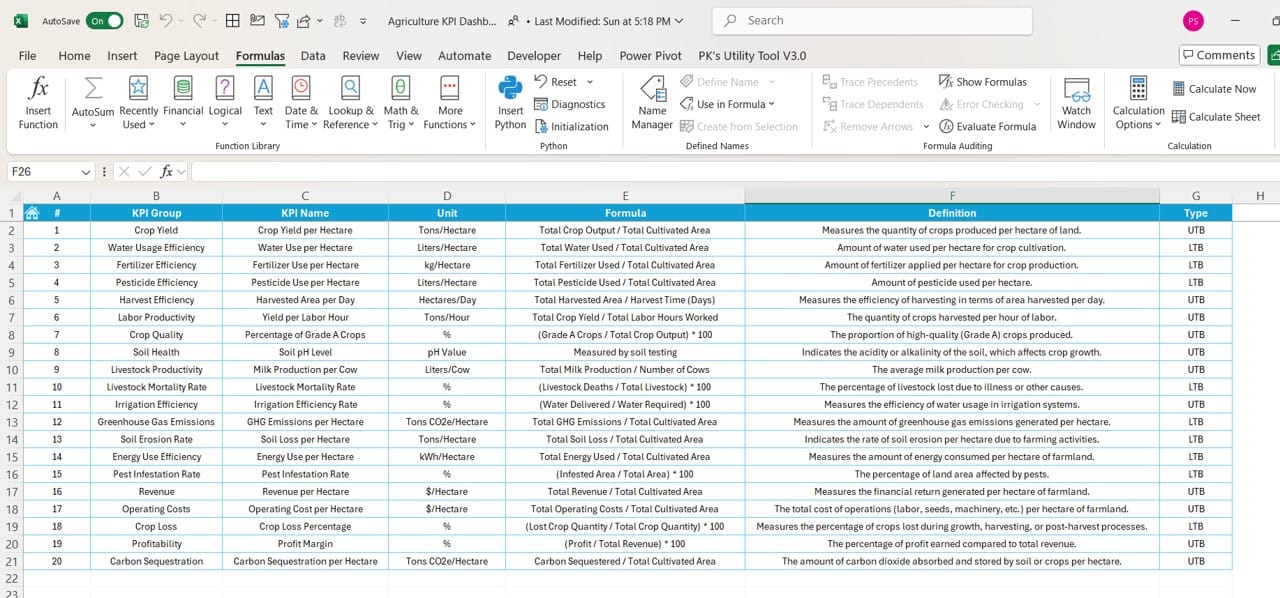
KPI Definition Sheet:
KPI Definition Sheet
A comprehensive reference sheet detailing the KPI name, group, unit, and formula for complete clarity.
Meet PK, the founder of PK-AnExcelExpert.com! With over 15 years of experience in Data Visualization, Excel Automation, and dashboard creation. PK is a Microsoft Certified Professional who has a passion for all things in Excel. PK loves to explore new and innovative ways to use Excel and is always eager to share his knowledge with others. With an eye for detail and a commitment to excellence, PK has become a go-to expert in the world of Excel. Whether you're looking to create stunning visualizations or streamline your workflow with automation, PK has the skills and expertise to help you succeed. Join the many satisfied clients who have benefited from PK's services and see how he can take your Excel skills to the next level!
In today’s data-driven automotive industry, leveraging key performance indicators (KPIs) through powerful tools like Power BI can significantly enhance decision-making
Managing expenses during and after a trip can sometimes feel like a never-ending chore, right? From keeping track of receipts
This website uses cookies to improve your user experience, analyze site traffic and serve targeted ads in accordance with our Privacy PolicyACCEPT
Privacy & Cookies Policy
Privacy Overview
This website uses cookies to improve your experience while you navigate through the website. Out of these cookies, the cookies that are categorized as necessary are stored on your browser as they are essential for the working of basic functionalities of the website. We also use third-party cookies that help us analyze and understand how you use this website. These cookies will be stored in your browser only with your consent. You also have the option to opt-out of these cookies. But opting out of some of these cookies may have an effect on your browsing experience.
Necessary cookies are absolutely essential for the website to function properly. This category only includes cookies that ensures basic functionalities and security features of the website. These cookies do not store any personal information.
Any cookies that may not be particularly necessary for the website to function and is used specifically to collect user personal data via analytics, ads, other embedded contents are termed as non-necessary cookies. It is mandatory to procure user consent prior to running these cookies on your website.