Alumni engagement is a cornerstone of any educational institution’s long-term success. Tracking and improving the involvement of alumni through key performance indicators (KPIs) is essential to cultivating a strong alumni network and sustaining relationships. The Alumni Engagement KPI Dashboard in Excel is an intuitive, ready-to-use tool designed to help institutions monitor and enhance alumni engagement through a wide range of KPIs. This dashboard offers detailed insights into alumni participation, donations, event attendance, and much more, providing institutions with valuable data for strategic decision-making.
Key Features of the Alumni Engagement KPI Dashboard in Excel
The Alumni Engagement KPI Dashboard is packed with features that make it easy to track and manage alumni engagement. Here are the key highlights:
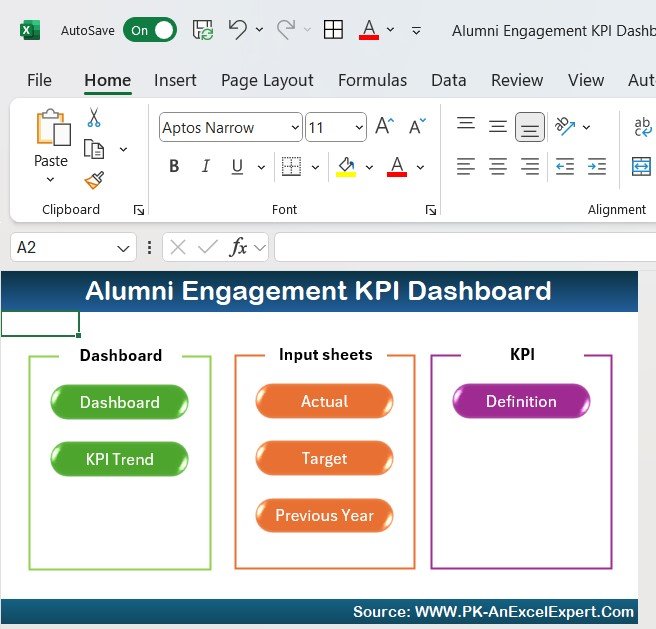
- Home Sheet: This is the index sheet where users can easily navigate to different sections of the dashboard. It includes six buttons that direct users to the corresponding sheets for detailed data.
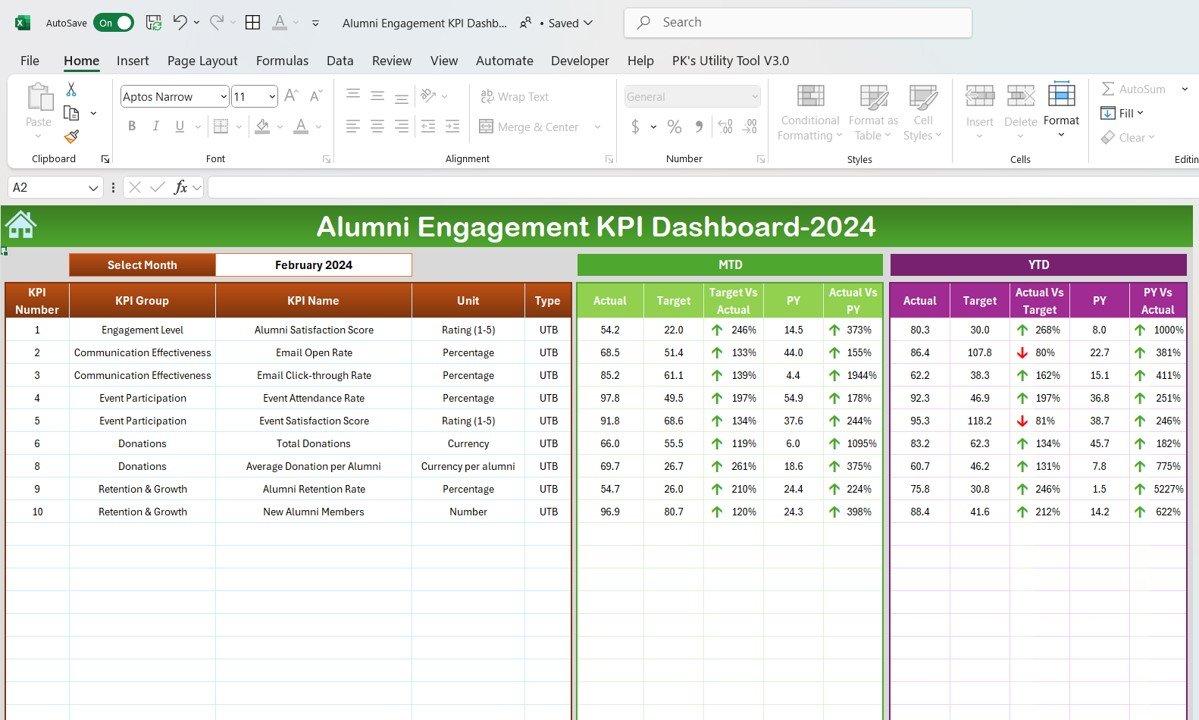
- Dashboard Sheet Tab: The heart of the dashboard, this sheet allows users to see key engagement metrics such as Month-to-Date (MTD) and Year-to-Date (YTD) figures, targets, and comparisons with previous years. Conditional formatting with up and down arrows provides a quick visual representation of performance.
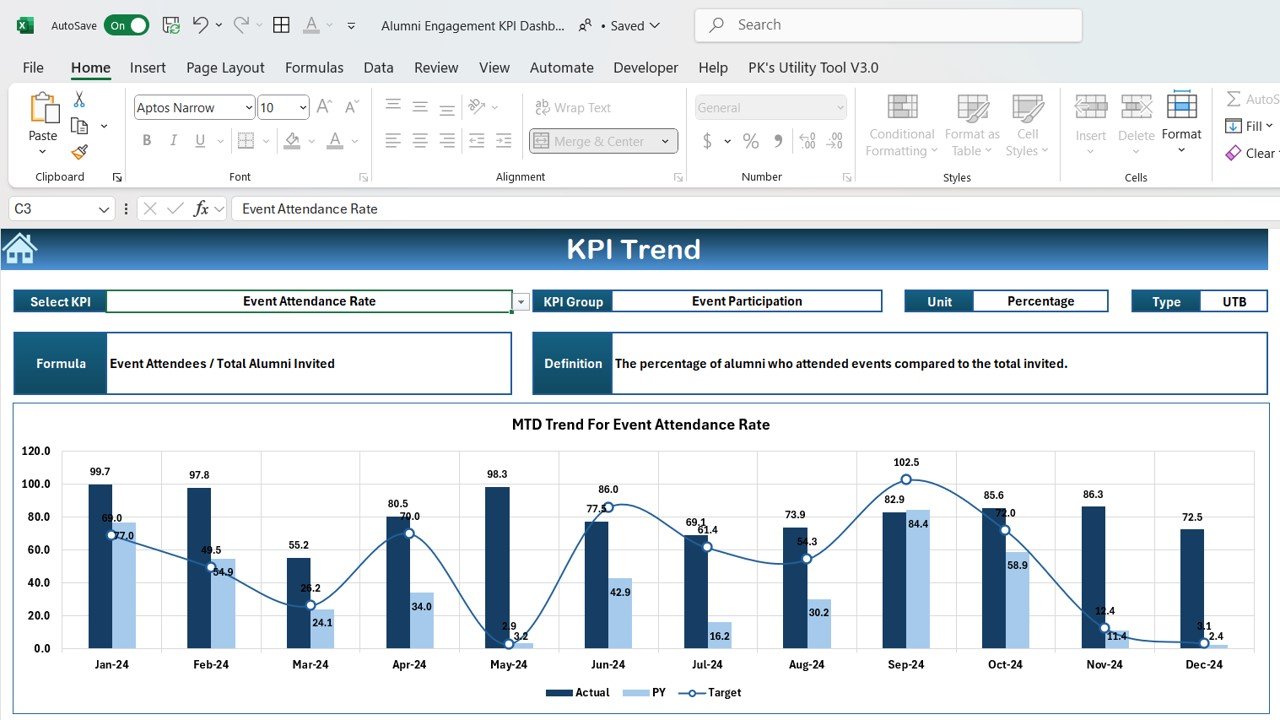
- KPI Trend Sheet Tab: This sheet displays trends over time for various KPIs, with options to choose specific KPIs, view their units of measurement, and track whether the KPI should be improved (Upper the Better) or reduced (Lower the Better).
- Actual Numbers Sheet Tab: This section allows users to input the actual engagement data for each KPI on a monthly basis, ensuring that all figures are up to date.
- Target Sheet Tab: Users can enter their monthly and yearly target numbers for each KPI, allowing for automatic comparisons with actual performance.
- Previous Year Numbers Sheet Tab: Here, users can input data from the previous year to enable year-over-year comparisons, providing deeper insights into trends and performance.
- KPI Definition Sheet Tab: This tab provides detailed definitions of each KPI, along with the units of measurement and formulas used to calculate them. This ensures clarity and consistency when interpreting the data.