Home>Download>Animated Speedometer Chart in Excel
Animated Speedometer

Animated Speedometer Chart in Excel

An Animated Speedometer Chart using Excel Charts and VBA. This impressive chart is ideal for business dashboards, providing a dynamic visual representation of your data. The animation runs when the value of the service level changes or when the worksheet is activated, adding an engaging element to your data presentation.
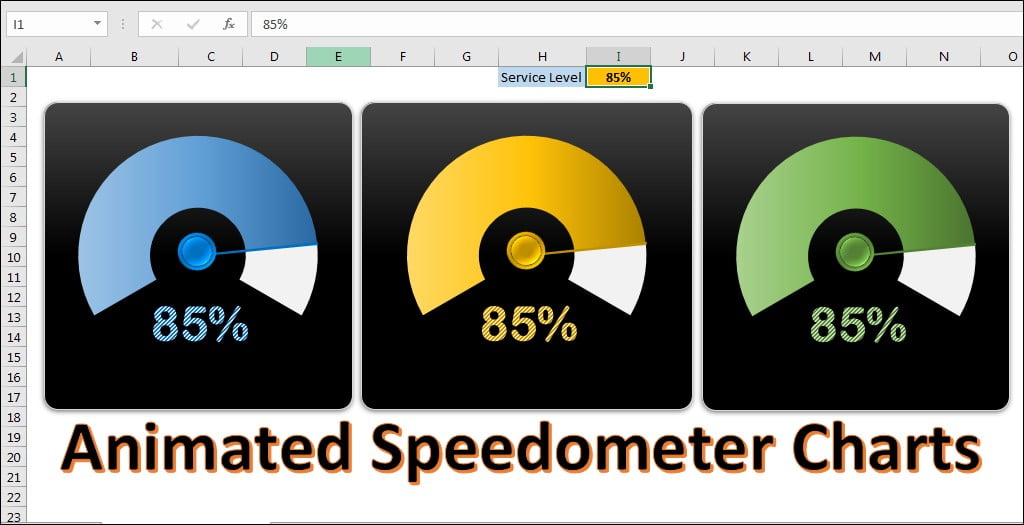
 

Animated Speedometer Chart in Excel

Key Features:

  • Dynamic Animation: Automatically animate the speedometer chart when data values change or when the worksheet is activated.
  • Excel Charts and VBA Integration: Leverage the power of Excel charts combined with VBA to create an interactive and visually appealing speedometer.
  • Business Dashboard Enhancement: Enhance your business dashboards with this eye-catching and informative speedometer chart, perfect for displaying service levels and other key metrics.


PK
Meet PK, the founder of PK-AnExcelExpert.com! With over 15 years of experience in Data Visualization, Excel Automation, and dashboard creation. PK is a Microsoft Certified Professional who has a passion for all things in Excel. PK loves to explore new and innovative ways to use Excel and is always eager to share his knowledge with others. With an eye for detail and a commitment to excellence, PK has become a go-to expert in the world of Excel. Whether you're looking to create stunning visualizations or streamline your workflow with automation, PK has the skills and expertise to help you succeed. Join the many satisfied clients who have benefited from PK's services and see how he can take your Excel skills to the next level!
https://www.pk-anexcelexpert.com