The Blockchain & Cryptocurrency KPI Dashboard in Power BI is a powerful and ready-to-use analytical tool designed to help businesses and investors track essential blockchain and cryptocurrency KPIs effortlessly. This dashboard seamlessly captures data from an Excel file, ensuring real-time insights into key performance metrics, trends, and targets. With interactive visuals and drill-through features, it simplifies data analysis for decision-making.
Key Features:
Three Interactive Dashboard Pages:
Summary Page:
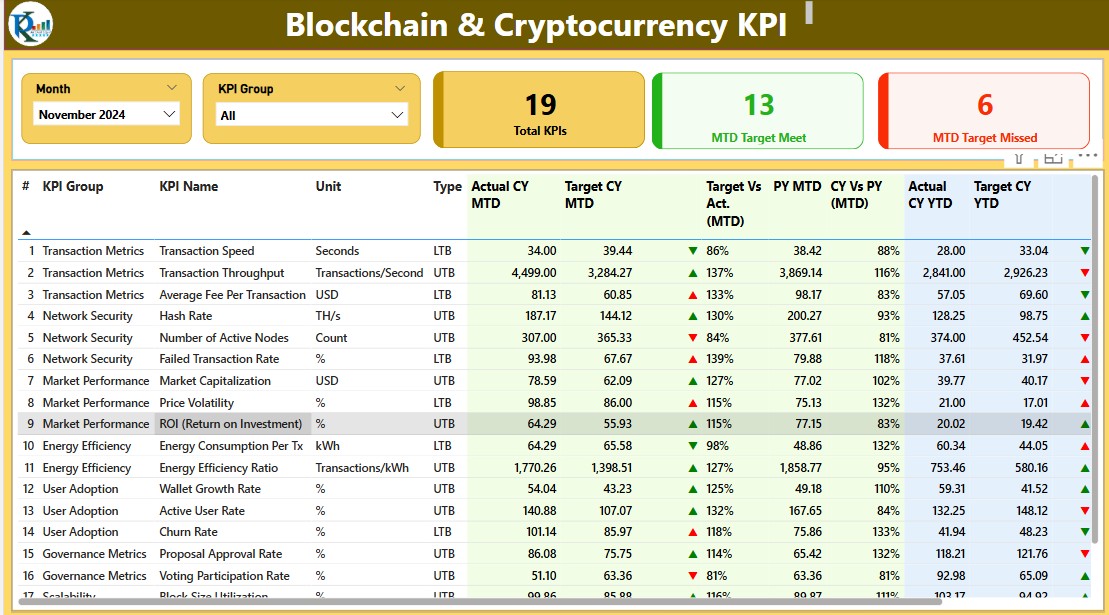
- Displays key performance indicators (KPIs) with slicers, KPI group filters, trend icons, and target vs actual comparisons.
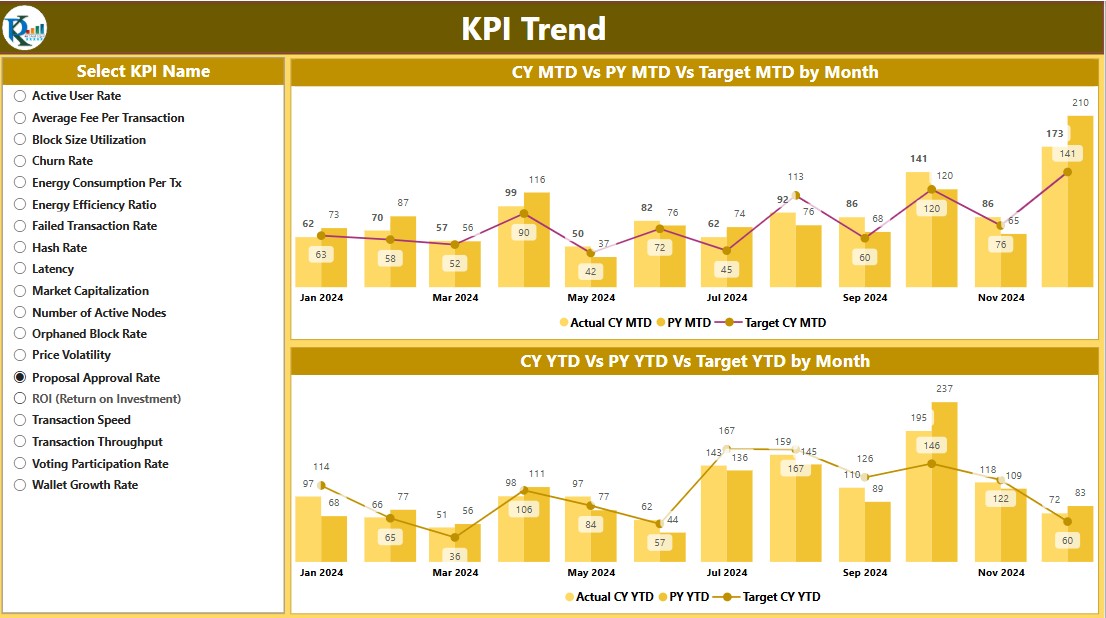
- KPI Trend Page: Showcases monthly and yearly trends through combo charts for actual vs. target comparisons.
- KPI Definition Page: Provides a detailed breakdown of KPI formulas, definitions, and performance types.
Comprehensive KPI Analysis:
- Tracks MTD (Month-to-Date) and YTD (Year-to-Date) performance.
- Comparison of Current Year vs. Previous Year metrics.
- Uses color-coded icons (▲ & ▼) for quick KPI performance visualization.
Seamless Data Integration:
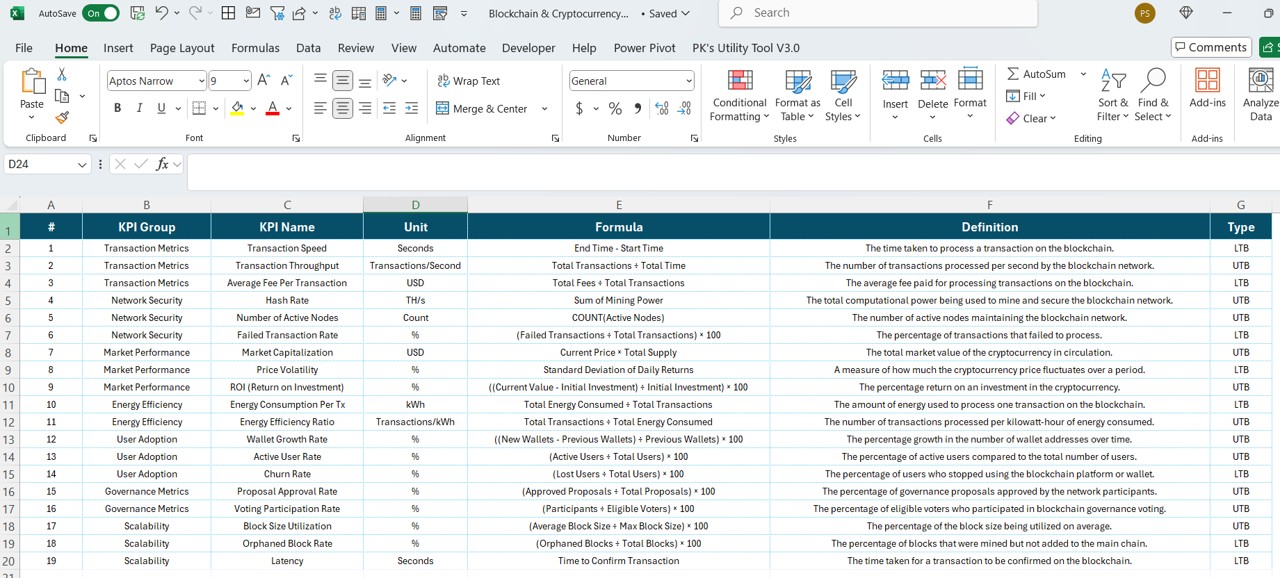
- Powered by Excel-based data input, allowing easy data entry for actual and target numbers.
- Includes predefined KPI groups, units, and performance formulas.
User-Friendly Navigation & Drill-Through Analysis:
- Slicers for KPI selection and month-based filtering.
- Drill-through feature for in-depth KPI insights.
- Back button navigation for a seamless user experience.