The Broadcasting KPI Dashboard in Power BI is a ready-to-use, interactive dashboard designed to streamline the tracking and analysis of broadcasting-specific KPIs. Built using Power BI and an Excel data source, this dynamic tool empowers you to make data-driven decisions with ease.
Key Features of the Broadcasting KPI Dashboard:
Summary Page:
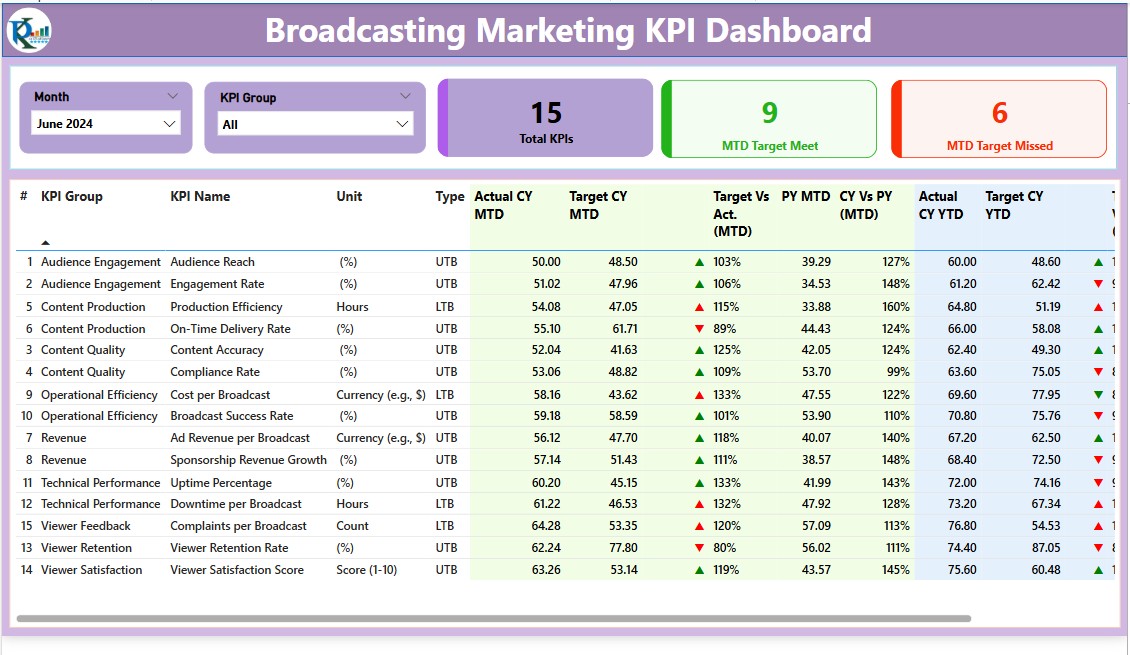
- Overview of KPIs with slicers for Month and KPI Group.
- KPI performance cards for Total Count, MTD Target Met, and MTD Target Missed.
- Detailed tables showing KPI metrics, comparisons (MTD/YTD), and visual indicators (▲/▼) for performance status.
KPI Trend Page:
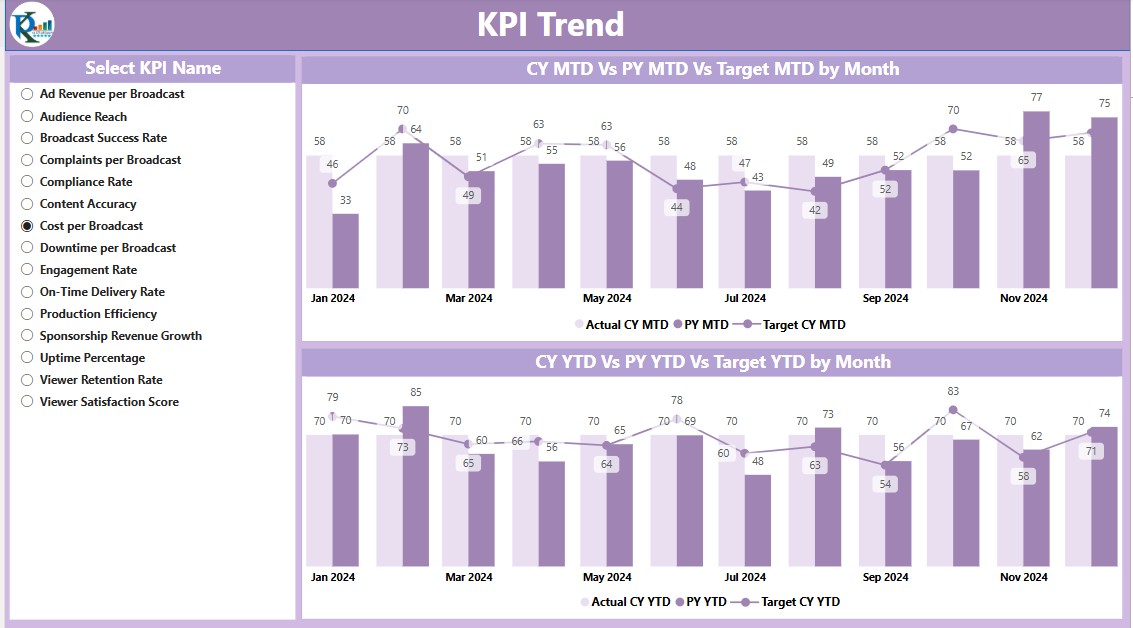
- Combo charts to display Current Year, Previous Year, and Target numbers for MTD and YTD.
- Slicer for selecting and analyzing specific KPIs.
KPI Definition Page:
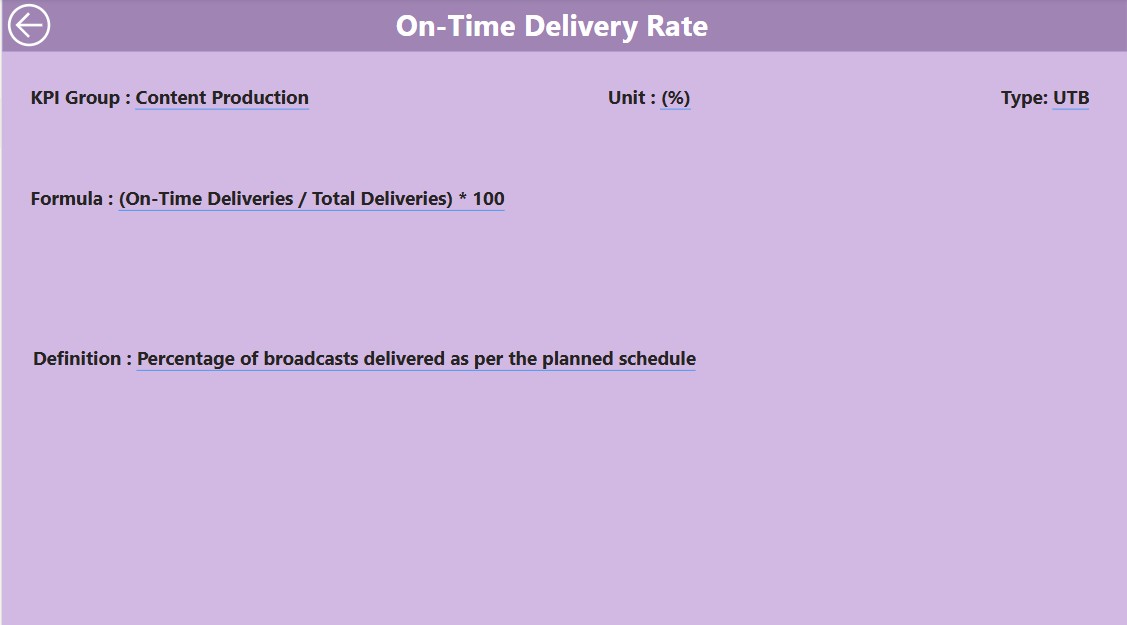
- Drill-through page containing formulas and KPI definitions.
- Hidden for a clean interface and accessible via the Summary Page.
Excel Data Integration:
- Easily update data using three preformatted Excel sheets: Actuals, Targets, and KPI Definitions.