Our Call Abandonment Rate KPI Dashboard in Excel is a ready-to-use, data-driven solution designed to help call centers monitor and optimize their call handling efficiency. With automated calculations, dynamic trend analysis, and real-time data visualization, this Excel dashboard ensures you can effectively track and reduce call abandonment rates.
Key Features of the Call Abandonment Rate KPI Dashboard
Home Sheet (Navigation Panel):
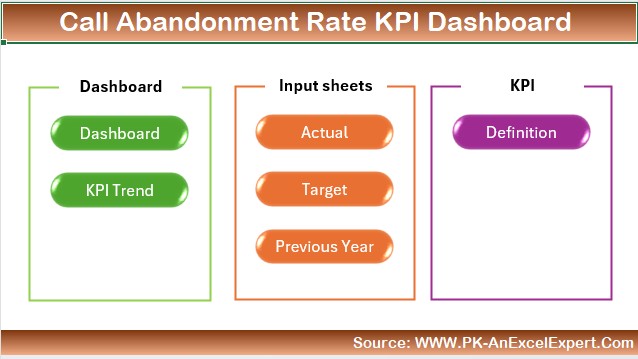
Easily access all sections with six interactive buttons.
Dashboard Sheet:
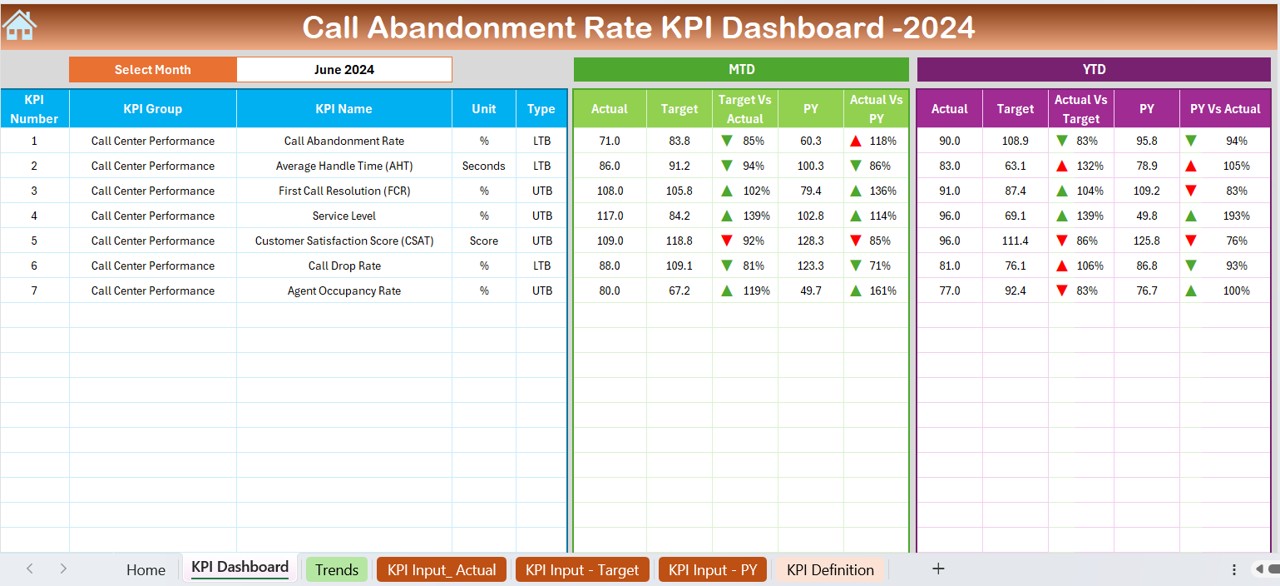
View MTD & YTD actuals, targets, and previous year comparisons with automated visual indicators.
KPI Trend Sheet:
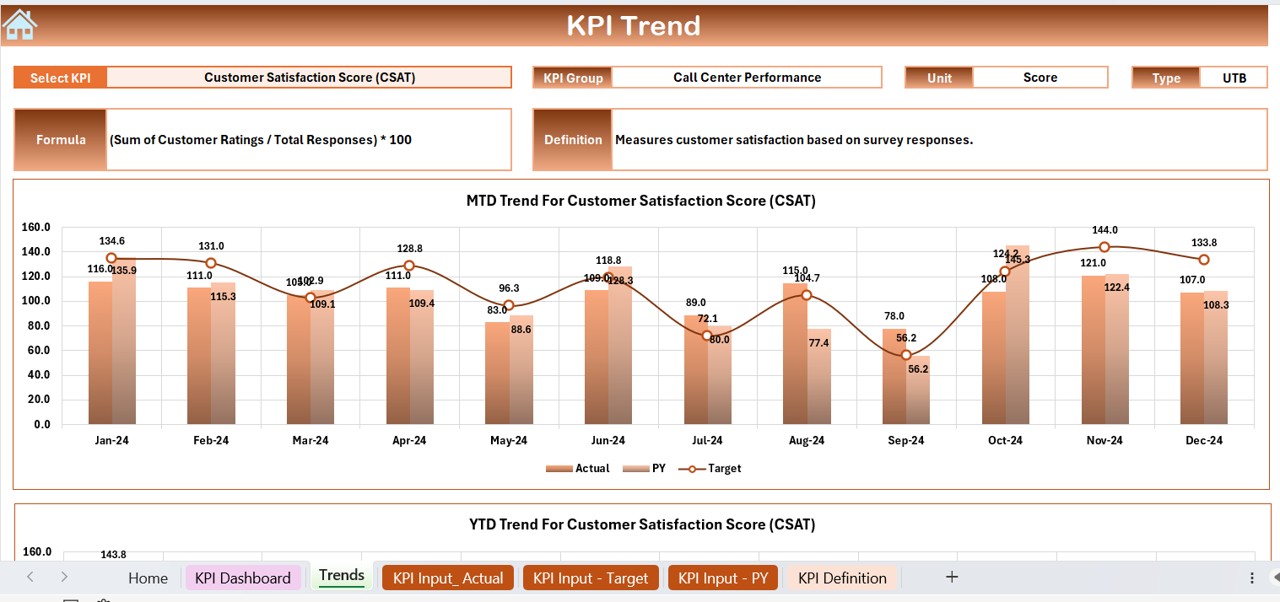
Select KPIs from a drop-down menu and analyze real-time trends with detailed charts.
Actual Numbers Input Sheet:
Seamlessly enter actual performance data and track monthly progress.
Target Sheet:
Define monthly KPI targets for both MTD and YTD performance.
Previous Year Data Sheet:
Store past performance metrics for easy comparison and trend analysis.
KPI Definition Sheet:
Maintain KPI names, formulas, units, and descriptions for consistency and clarity.