PKComments Off on An Innovative chart for team level performance
Unveil the power of team performance visualization with our Innovative Chart for Team Level Performance in Excel. Crafted meticulously with a Line with Marker chart, this tool is designed to
PKComments Off on Stylish Butterfly Chart – Version 1
Introducing the "Stylish Butterfly Chart - Version 1," an innovative Excel visualization tool designed to compare the performance of two teams across various key performance indicators (KPIs). This visually striking
PKComments Off on Innovation: Focus Chart in Excel
Unlock the full potential of performance tracking with our "Innovation: Focus Chart in Excel," a creative tool designed to spotlight top performers dynamically. This chart features a unique visual element—a
PKComments Off on RAG Conditional Formatting in 3D Chart
This is a beautiful 3D chart to display sales conversions for different products using RAG (Red, Amber, and Green) Conditional Formatting. This dynamic chart is connected to a color condition
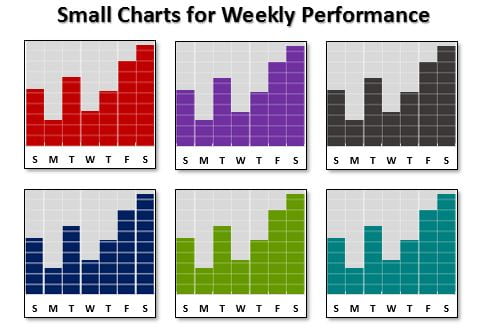
PKComments Off on Small Charts for Weekly Performance
Creating Small Charts for Weekly Performance in Excel allows you to efficiently present data without consuming excessive space on your dashboard. These charts provide a clear, concise way to visualize
PKComments Off on Progress Bar in Excel Cells using Conditional Formatting
This is a template of Progress Bar in Excel cells using Conditional Formatting. It is a ready to use template. [caption id="attachment_18056" align="aligncenter" width="581"] Progress Bar in Excel Cells
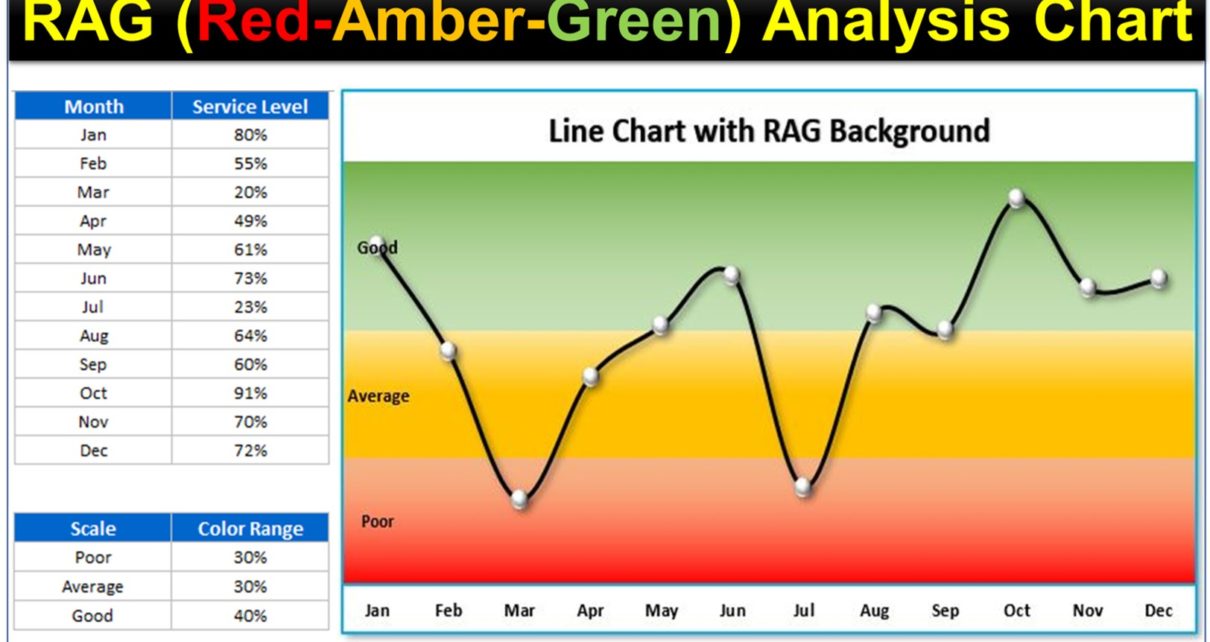
PKComments Off on RAG (Red, Amber and Green) Analysis Chart in Excel
RAG (Red, Amber, and Green) Analysis Chart is an effective tool for performance analysis in Excel. This chart can make your Excel Report more useful Analysis Chart in Excel. [caption
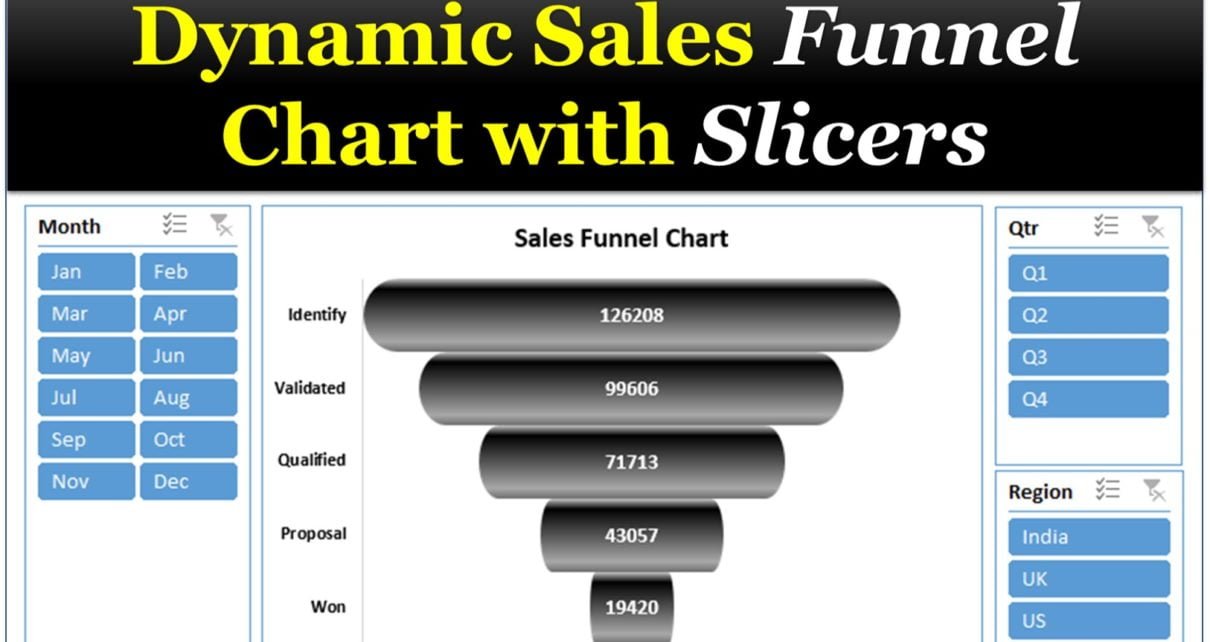
PKComments Off on Dynamic Sales Funnel Chart with Slicers
This is a fully functional Excel template for dynamic Sales Funnel Chart with Slicers. This chart is perfect for enhancing your business dashboards or presentations, providing a visually appealing way
PKComments Off on Dynamic Chart with Form Control Scrollbar
We demonstrate a Dynamic Chart with a Form Control Scrollbar in Excel. This powerful tool allows you to visualize data over a rolling period, such as 10 or 15 days,
PKComments Off on Cross Filter Functionality in Excel Chart
Excel is a powerful tool that provides a wide range of features to help you analyze and present data effectively. One of the key features in Excel is the charting
This website uses cookies to improve your user experience, analyze site traffic and serve targeted ads in accordance with our Privacy PolicyACCEPT
Privacy & Cookies Policy
Privacy Overview
This website uses cookies to improve your experience while you navigate through the website. Out of these cookies, the cookies that are categorized as necessary are stored on your browser as they are essential for the working of basic functionalities of the website. We also use third-party cookies that help us analyze and understand how you use this website. These cookies will be stored in your browser only with your consent. You also have the option to opt-out of these cookies. But opting out of some of these cookies may have an effect on your browsing experience.
Necessary cookies are absolutely essential for the website to function properly. This category only includes cookies that ensures basic functionalities and security features of the website. These cookies do not store any personal information.
Any cookies that may not be particularly necessary for the website to function and is used specifically to collect user personal data via analytics, ads, other embedded contents are termed as non-necessary cookies. It is mandatory to procure user consent prior to running these cookies on your website.