PKComments Off on Employee and Supervisor Chart with Arrow info graphics
Visualize hierarchical relationships with ease using the Employee and Supervisor Chart with Arrow infographics in Excel. This dynamic chart offers a clear and engaging way to present the connections between
PKComments Off on Sales funnel infographic chart in Excel
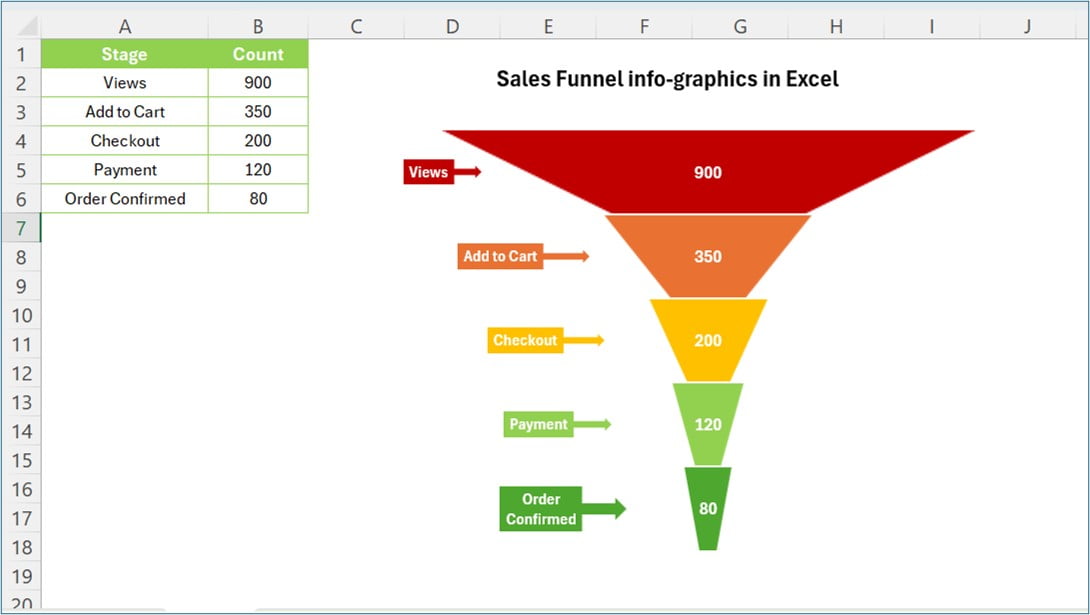
Unlock the power of data visualization with our Sales Funnel Infographic Chart in Excel. This dynamic chart transforms your e-commerce sales data into a visually engaging funnel that updates automatically
PKComments Off on Dynamic Colorful Progress Bars in Excel cells
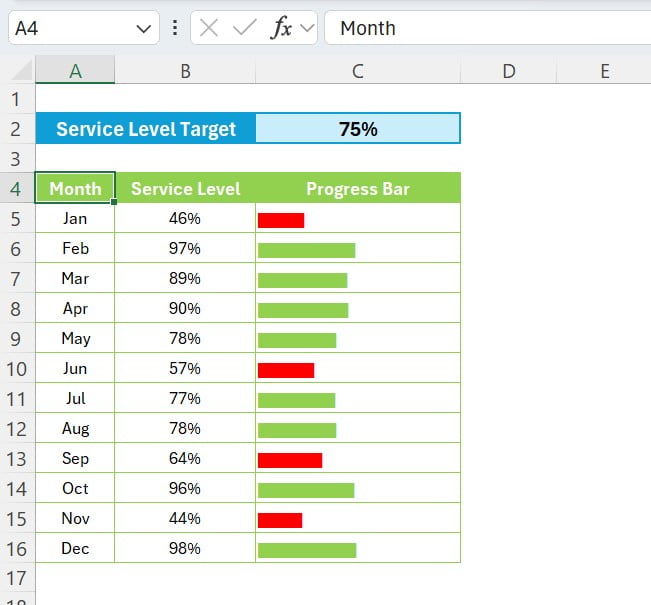
Take your Excel skills to the next level with our Dynamic Colorful Progress Bars in Excel Cells. This powerful technique transforms standard data into visually engaging progress bars, perfect for
PKComments Off on Road and Flag infographics chart in Excel
The "Road and Flag Infographics Chart in Excel" takes data visualization to a whole new level, transforming static data into a vibrant, interactive infographic. Designed for both beginners and Excel
Explore the power of interactive data visualization with our VBA Dynamic Chart on User Form template. This tool brings data to life with fully dynamic KPI charts, seamlessly updating in
PKComments Off on Annual Sales Calendar for Sales Dashboard in Excel
The Annual Sales Calendar for Sales Dashboard in Excel is a formula-based tool designed to simplify yearly sales tracking without requiring VBA coding. This intuitive template combines form controls like
PKComments Off on Project Plan (Gantt Chart) in Excel
Our Project Plan (Gantt Chart) in Excel file offers a streamlined way to organize, manage, and track project progress. Designed for both beginners and experienced users, this Excel-based Gantt Chart
PKComments Off on Dynamic Project Planner (Gantt Chart) in Excel
Optimize your project management with our Dynamic Project Planner (Gantt Chart) in Excel. This Excel-based Gantt chart allows you to switch seamlessly between daily and weekly views, enabling flexible planning
Enhance your project management with our Power Gantt Chart, a dynamic project planner created in Microsoft Excel with Power Pivot. This comprehensive template is perfect for integrating into your Project
PKComments Off on Dynamic Hourly Gantt Chart for Projects
Our Dynamic Hourly Project Planner (Gantt Chart) Excel template is designed to provide project managers with a precise, hour-by-hour view of tasks, helping streamline project timelines and optimize resource allocation.
This website uses cookies to improve your user experience, analyze site traffic and serve targeted ads in accordance with our Privacy PolicyACCEPT
Privacy & Cookies Policy
Privacy Overview
This website uses cookies to improve your experience while you navigate through the website. Out of these cookies, the cookies that are categorized as necessary are stored on your browser as they are essential for the working of basic functionalities of the website. We also use third-party cookies that help us analyze and understand how you use this website. These cookies will be stored in your browser only with your consent. You also have the option to opt-out of these cookies. But opting out of some of these cookies may have an effect on your browsing experience.
Necessary cookies are absolutely essential for the website to function properly. This category only includes cookies that ensures basic functionalities and security features of the website. These cookies do not store any personal information.
Any cookies that may not be particularly necessary for the website to function and is used specifically to collect user personal data via analytics, ads, other embedded contents are termed as non-necessary cookies. It is mandatory to procure user consent prior to running these cookies on your website.