PKComments Off on 
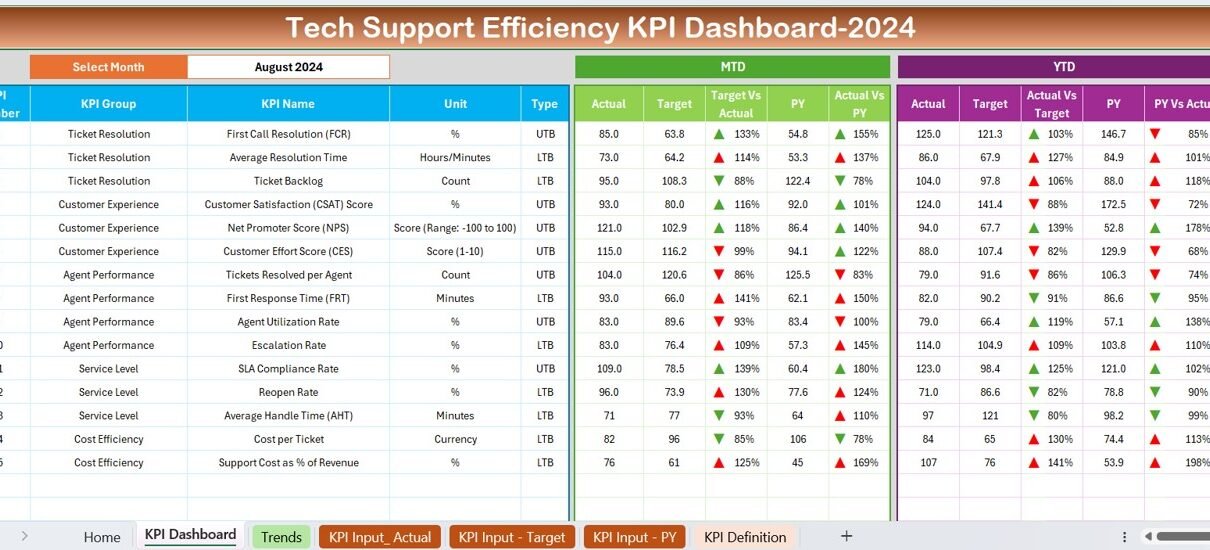
Data Breach Response KPI Dashboard in Excel
In today’s digital landscape, the risk of data breaches is more prevalent than ever. For organizations that deal with sensitive information, having a robust system to manage, track, and respond
PKComments Off on Tech Support Efficiency KPI Dashboard in Excel
Boost your tech support performance with our Tech Support Efficiency KPI Dashboard in Excel—a ready-to-use solution for tracking and analyzing Digital Asset Management KPIs. This dashboard provides a structured approach
PKComments Off on Digital Asset Management KPI Dashboard in Excel
The Digital Asset Management KPI Dashboard in Excel is a ready-to-use template designed to help businesses efficiently track and analyze key performance indicators (KPIs) related to their digital assets. This
PKComments Off on Cloud Migration KPI Dashboard in Excel
Streamline your cloud migration process with our Cloud Migration KPI Dashboard in Excel. This ready-to-use, data-driven template helps organizations track, analyze, and optimize key migration performance indicators (KPIs) effectively. With
PKComments Off on HR Compliance KPI Dashboard in Excel
HR compliance is essential for every organization to ensure adherence to legal regulations and internal policies. Without the right tools to measure and monitor HR compliance, organizations risk falling behind
PKComments Off on Learning & Development KPI Dashboard in Excel
This comprehensive dashboard acts as a central hub for all of your L&D metrics, allowing you to make informed decisions and improve your training programs. In this article, we’ll take
PKComments Off on Server Uptime KPI Dashboard in Excel
Tracking server uptime is crucial for IT performance management, ensuring optimal system reliability and minimal downtime. Our Server Uptime KPI Dashboard in Excel is a ready-to-use template that helps IT
PKComments Off on Bug Resolution KPI Dashboard in Excel
Managing and resolving bugs efficiently is crucial for software teams to maintain quality and user satisfaction. Our Bug Resolution KPI Dashboard in Excel is a ready-to-use template designed to help
PKComments Off on Scrum Team KPI Dashboard in Excel
Boost your Scrum team’s performance with this Scrum Team KPI Dashboard in Excel – a fully customizable and interactive dashboard designed to track and analyze key performance indicators (KPIs) efficiently.
The DevOps KPI Dashboard in Excel is a ready-to-use, comprehensive solution designed to track and analyze key performance indicators (KPIs) for DevOps teams. This dashboard helps teams monitor their performance
This website uses cookies to improve your user experience, analyze site traffic and serve targeted ads in accordance with our Privacy PolicyACCEPT
Privacy & Cookies Policy
Privacy Overview
This website uses cookies to improve your experience while you navigate through the website. Out of these cookies, the cookies that are categorized as necessary are stored on your browser as they are essential for the working of basic functionalities of the website. We also use third-party cookies that help us analyze and understand how you use this website. These cookies will be stored in your browser only with your consent. You also have the option to opt-out of these cookies. But opting out of some of these cookies may have an effect on your browsing experience.
Necessary cookies are absolutely essential for the website to function properly. This category only includes cookies that ensures basic functionalities and security features of the website. These cookies do not store any personal information.
Any cookies that may not be particularly necessary for the website to function and is used specifically to collect user personal data via analytics, ads, other embedded contents are termed as non-necessary cookies. It is mandatory to procure user consent prior to running these cookies on your website.