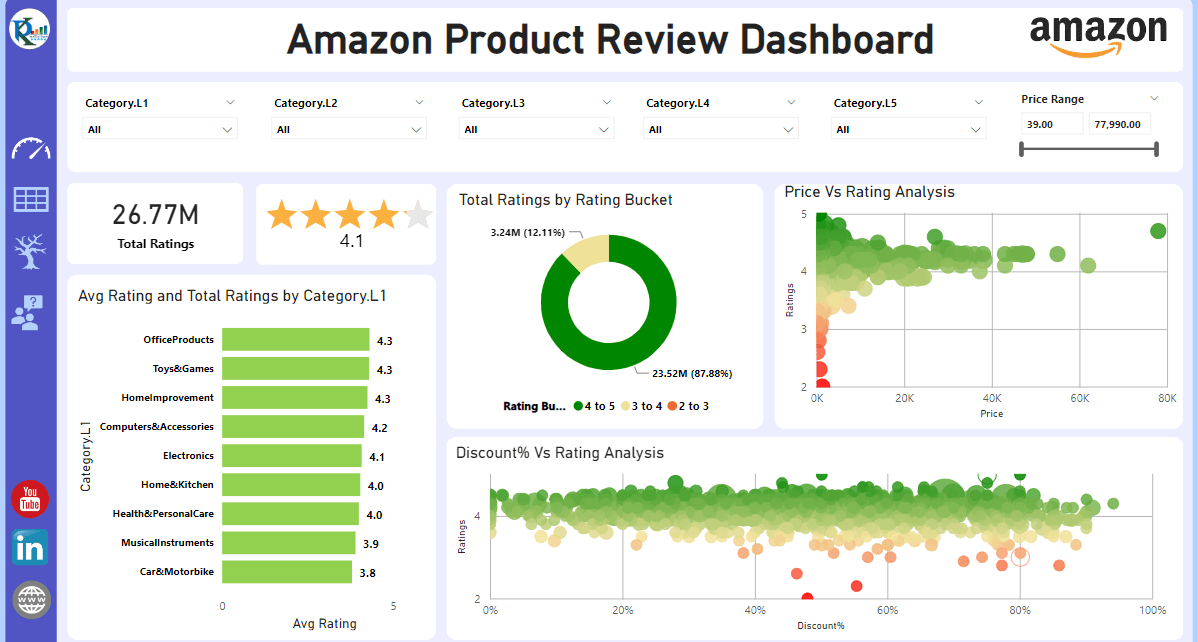
Product Review Dashboard in Power BI
Amazon Product Review Dashboard in Power BI is ready to use dashboard in Power BI. If you are a Amazon seller or you have your data for Amazon product. [caption
Transforming Data into Decisions