PKComments Off on Profit Optimizer in Excel using Multiple Regression
Unlock the potential of your sales data with our Profit Optimizer in Excel, utilizing Multiple Regression analysis to forecast sales outcomes based on multiple influencing factors. This tool is designed
PKComments Off on Excel Forecast Formula – Predicting Best Selling Price for Maximum Profit
Determining the optimal selling price for products is pivotal for maximizing profitability in any business. Our Excel Forecast Formula tool leverages historical sales data to predict the best selling price
PKComments Off on Target Vs Actual Sales Dynamic Chart
Elevate your sales management with our Target Vs Actual Sales Dynamic Chart Excel Template. This innovative tool is specifically designed to track and compare the sales performance of individual team
PKComments Off on Dynamic Conditional Formatting in Excel
Dynamic Conditional Formatting in Excel using Form Control Option Buttons. This advanced technique allows you to change Conditional Formatting styles, such as Heat Map, Data Bar, and Traffic Lights, based
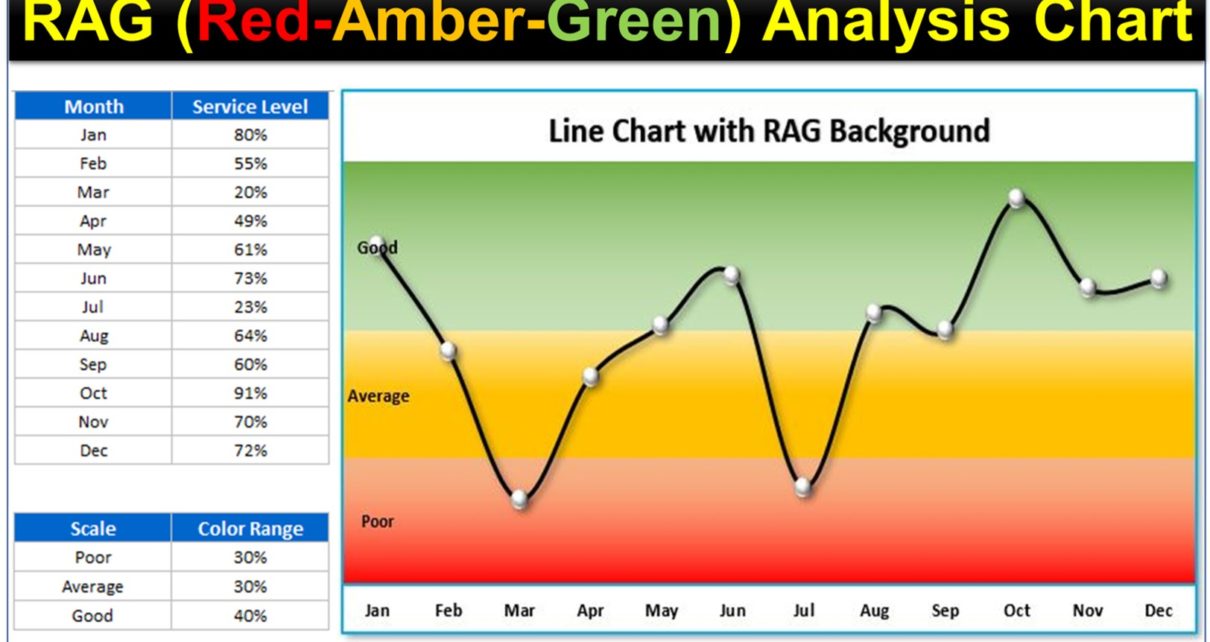
PKComments Off on RAG (Red, Amber and Green) Analysis Chart in Excel
RAG (Red, Amber, and Green) Analysis Chart is an effective tool for performance analysis in Excel. This chart can make your Excel Report more useful Analysis Chart in Excel. [caption
PKComments Off on Break-Even Analysis Template in Excel
This ready-to-use Break-Even Analysis Template in Excel helps you determine the minimum number of units that need to be sold to cover all business expenses. Designed for ease of use,
PKComments Off on Weightage Analysis Template in Microsoft Excel
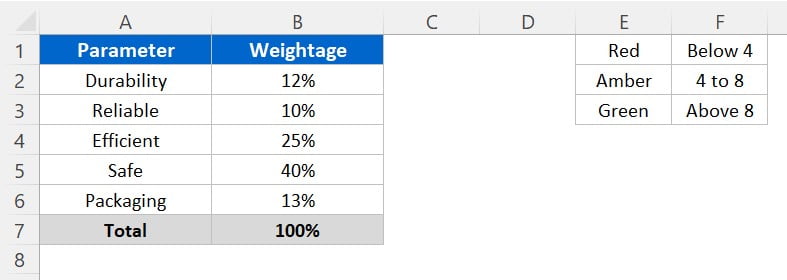
This Weightage Analysis Template in Excel allows you to calculate weighted scores based on multiple parameters, providing a comprehensive evaluation of product performance. With customizable weightages and an intuitive spin
PKComments Off on Top/Bottom Analysis dashboard in Excel
The Top/Bottom Analysis Dashboard in Excel is a powerful tool designed to highlight top and bottom performers across key metrics like employee and location-based sales performance. This dynamic dashboard simplifies
PKComments Off on Quality Analysis Dashboard in Power BI
Our Quality Analysis Dashboard in Power BI is designed to offer deep insights into quality performance, focusing on key metrics such as Total Tasks, Sample Count, Defects, Fatal Errors, and
PKComments Off on Comparative Analysis Dashboard in Power BI
The Comparative Analysis Dashboard in Power BI is a comprehensive tool crafted to offer businesses valuable insights into sales performance over time. By comparing current-year sales against previous years and
This website uses cookies to improve your user experience, analyze site traffic and serve targeted ads in accordance with our Privacy PolicyACCEPT
Privacy & Cookies Policy
Privacy Overview
This website uses cookies to improve your experience while you navigate through the website. Out of these cookies, the cookies that are categorized as necessary are stored on your browser as they are essential for the working of basic functionalities of the website. We also use third-party cookies that help us analyze and understand how you use this website. These cookies will be stored in your browser only with your consent. You also have the option to opt-out of these cookies. But opting out of some of these cookies may have an effect on your browsing experience.
Necessary cookies are absolutely essential for the website to function properly. This category only includes cookies that ensures basic functionalities and security features of the website. These cookies do not store any personal information.
Any cookies that may not be particularly necessary for the website to function and is used specifically to collect user personal data via analytics, ads, other embedded contents are termed as non-necessary cookies. It is mandatory to procure user consent prior to running these cookies on your website.