The Circular Economy KPI Dashboard in Power BI provides businesses with a powerful tool to monitor and evaluate their sustainability performance. By visualizing key performance indicators (KPIs), businesses can track their progress towards circular economy goals, make data-driven decisions, and identify areas for improvement. This dashboard integrates seamlessly with Excel, ensuring that all data is easily managed and updated.
Key Features of the Circular Economy KPI Dashboard in Power BI
Summary Page
- View a high-level overview of all KPIs and filter by month and KPI group.
- Track performance using color-coded icons for MTD and YTD data.
- See detailed KPI information, including comparison to previous year and target vs actual data.

KPI Trend Page
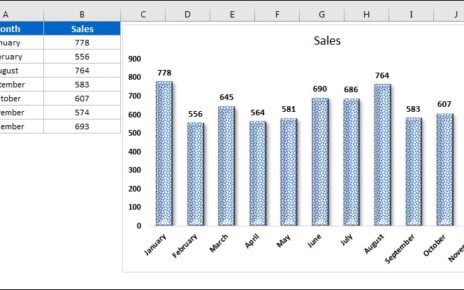
- Visualize KPI performance over time using combo charts.
- Compare Actual Numbers for Current Year (CY), Previous Year (PY), and Targets for MTD and YTD.
- Use slicers to easily select a specific KPI for analysis.

KPI Definition Page
- Drill-through to see detailed KPI definitions and formulas.
- Learn the significance of each KPI and its role in sustainability efforts.

Excel Data Integration
- Easy integration with Excel for entering and managing data.
- Manage actual and target numbers for each KPI through user-friendly input sheets.
By leveraging this dashboard, organizations can monitor their circular economy efforts efficiently, ensuring that they make continuous progress toward sustainability goals.