The Climate Action KPI Dashboard in Excel is a comprehensive and ready-to-use template designed to help organizations track, analyze, and visualize key performance indicators (KPIs) for their climate action initiatives. This powerful tool simplifies data management, providing actionable insights to measure progress toward sustainability goals effectively.
Key Features of the Climate Action KPI Dashboard
Home Sheet:
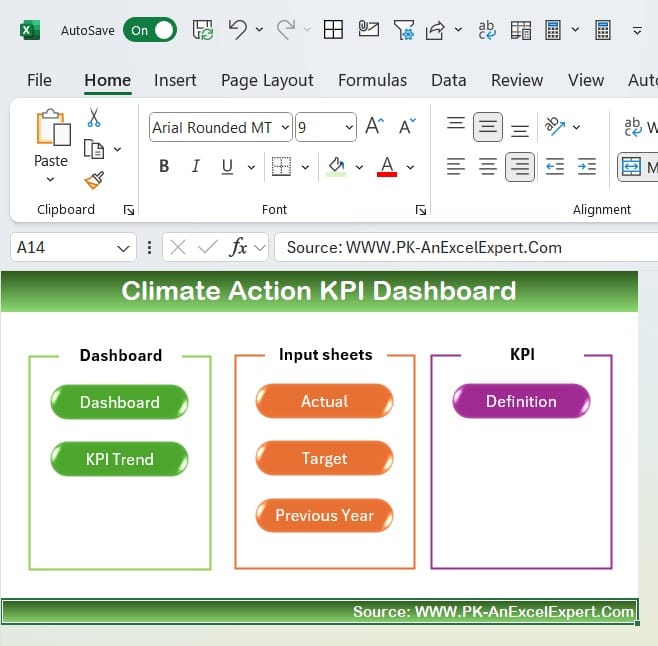
- An intuitive navigation hub with six buttons that allow users to jump directly to the respective sheets effortlessly.
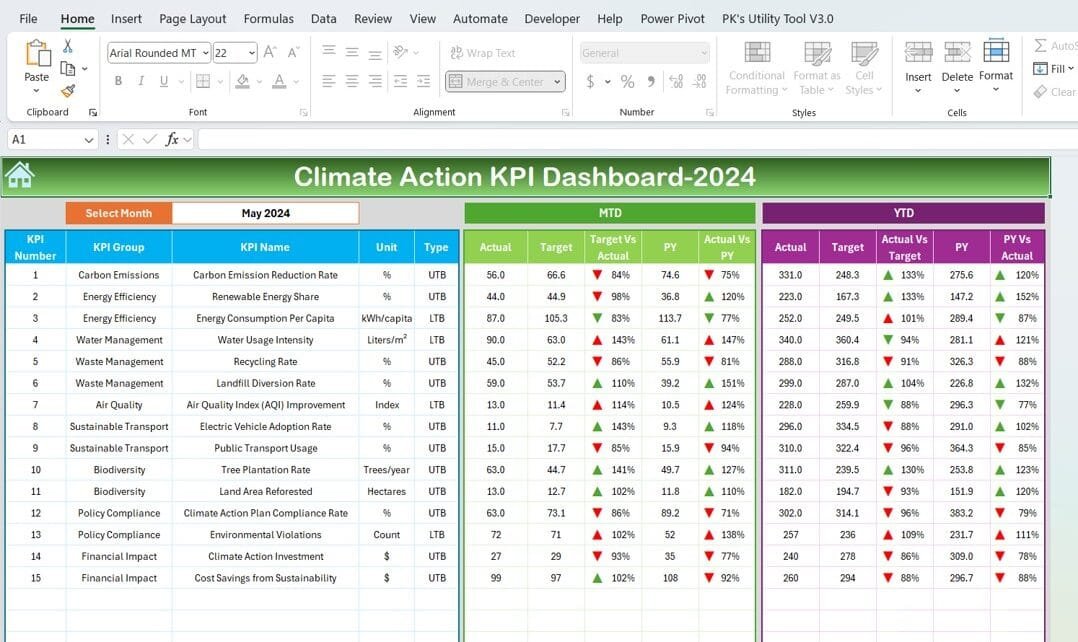
Dashboard Sheet Tab:
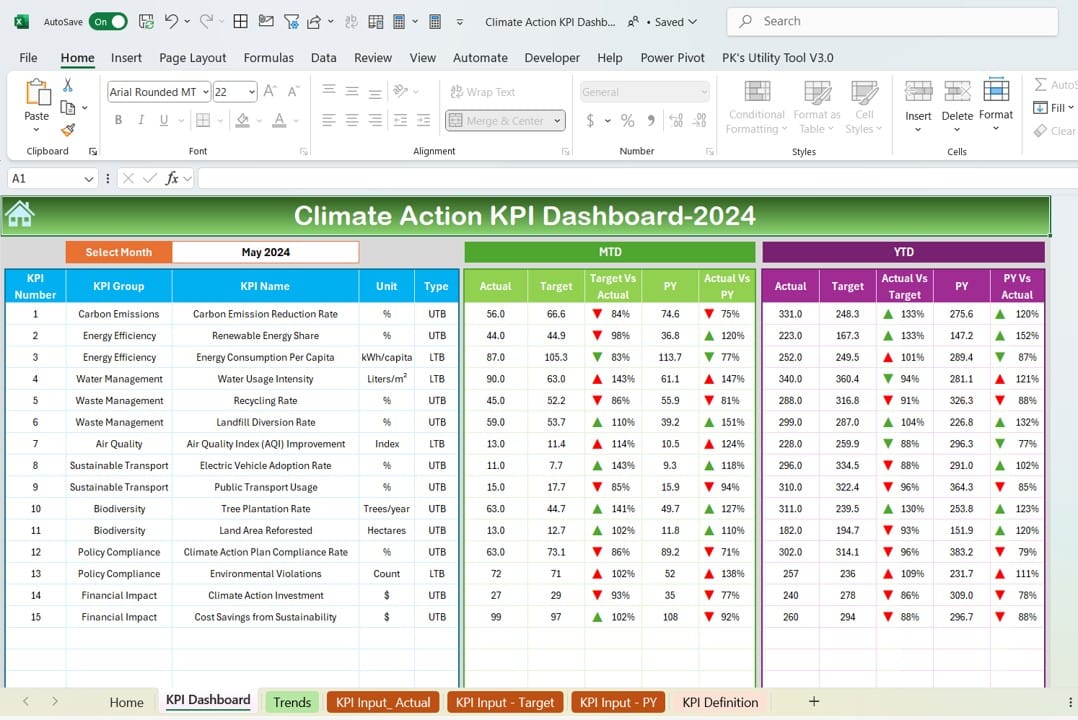
- Displays all KPI information with dynamic updates based on the selected month.
- Includes MTD and YTD data for Actual, Target, and Previous Year with conditional formatting arrows to highlight trends.
KPI Trend Sheet Tab:
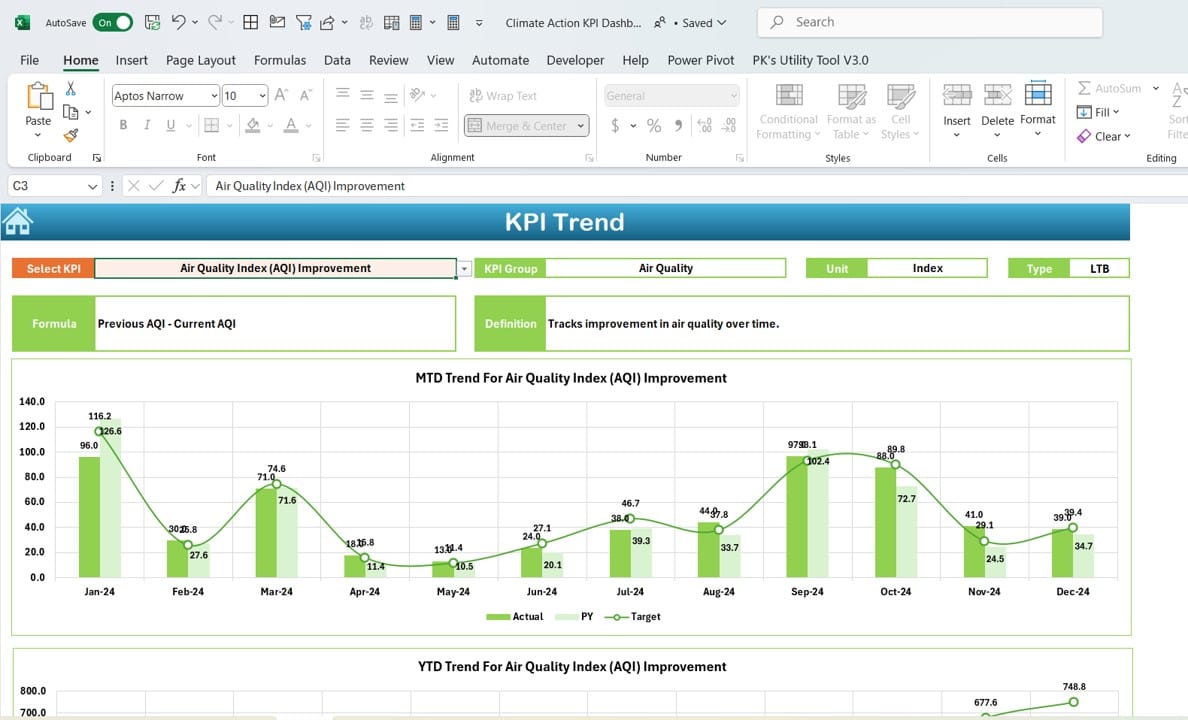
- Allows users to select KPIs and view details like group, unit, type, formula, and definition.
- Provides MTD and YTD trend charts for Actual, Target, and PY values.
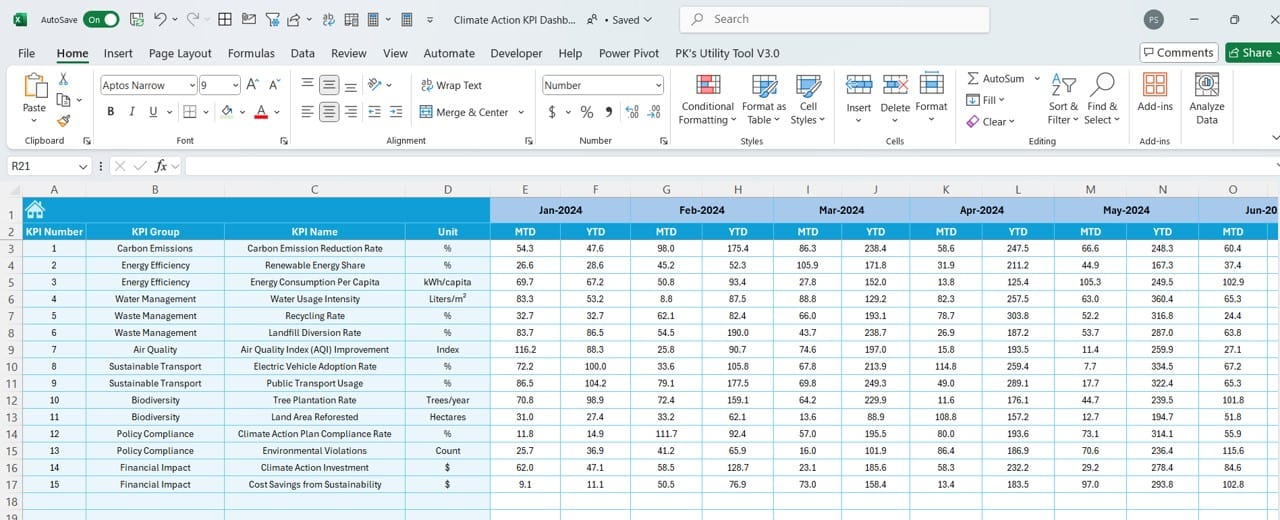
Actual Numbers Input Sheet:
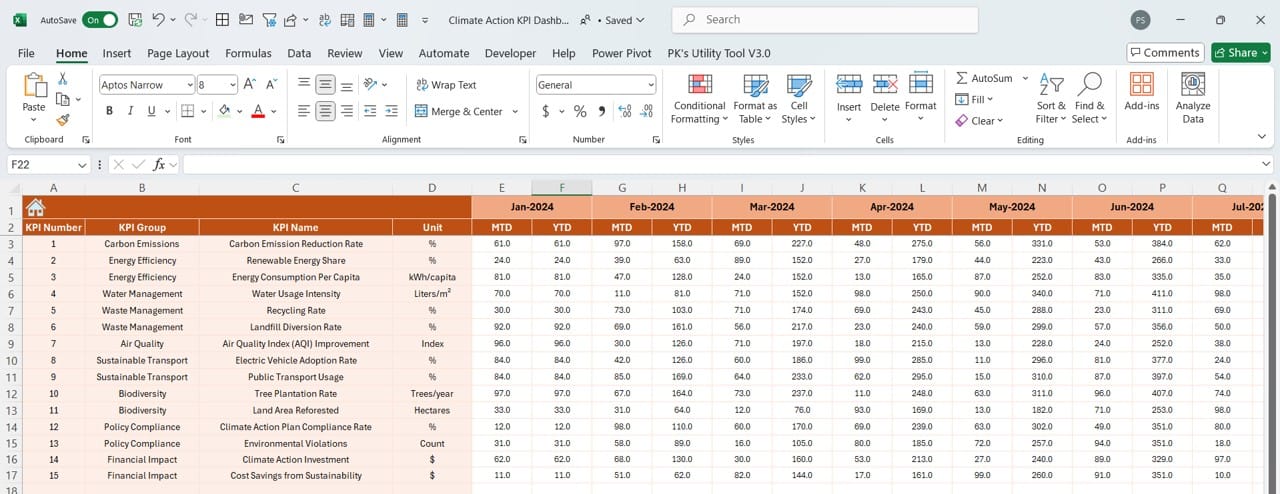
- A dedicated space to input YTD and MTD actual numbers, with automated month adjustments based on the starting month entered.
Target Sheet Tab:
- Enables users to set both MTD and YTD targets for each KPI, ensuring clear benchmarks.
Previous Year Numbers Sheet Tab:
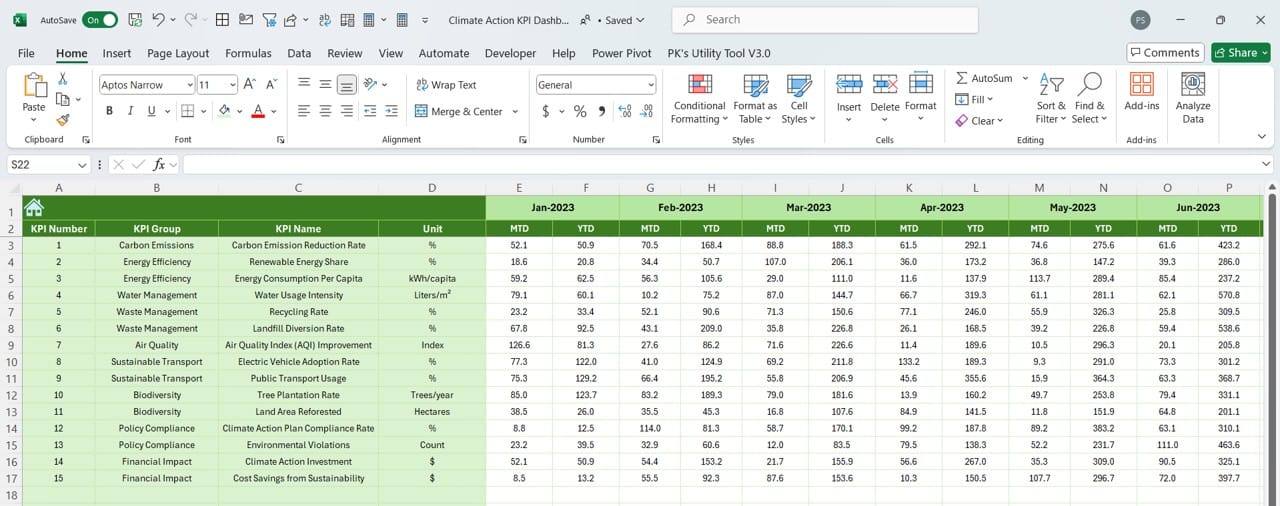
- Helps maintain historical data for seamless year-over-year comparisons.
KPI Definition Sheet Tab:
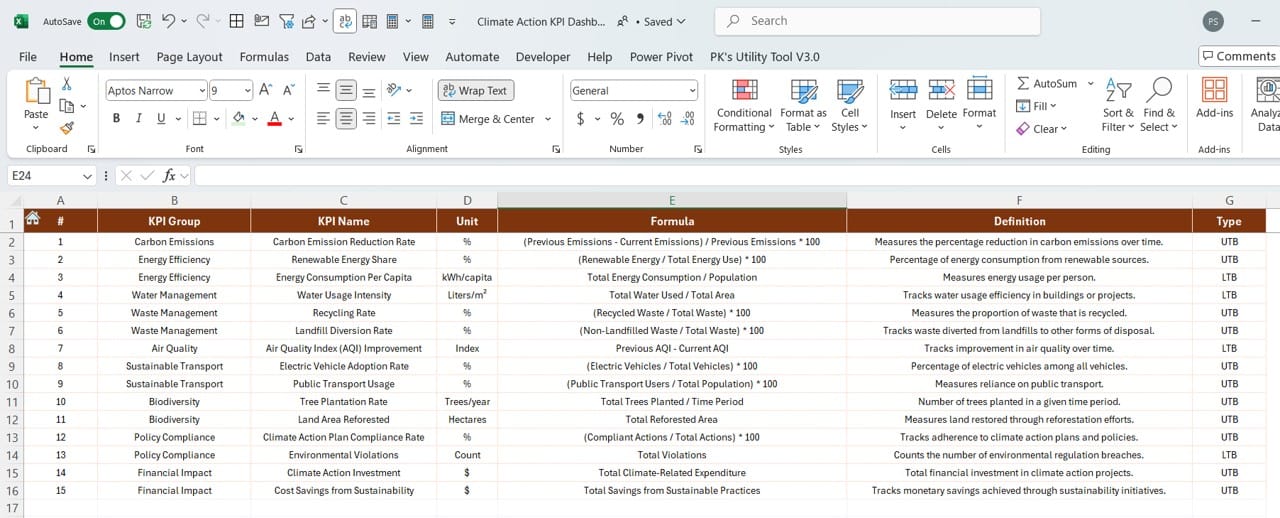
- Provides a structured format to define each KPI, including its name, group, unit, formula, and purpose.
Read the detailed blog post


