The Climate Action KPI Dashboard in Power BI is a powerful, ready-to-use solution designed to help organizations track and manage their sustainability and environmental impact KPIs. With an Excel-based data input system, this dashboard provides real-time insights, trend analysis, and comprehensive KPI monitoring to drive data-driven climate actions effectively.
Key Features of the Climate Action KPI Dashboard
Three Interactive Dashboard Pages:
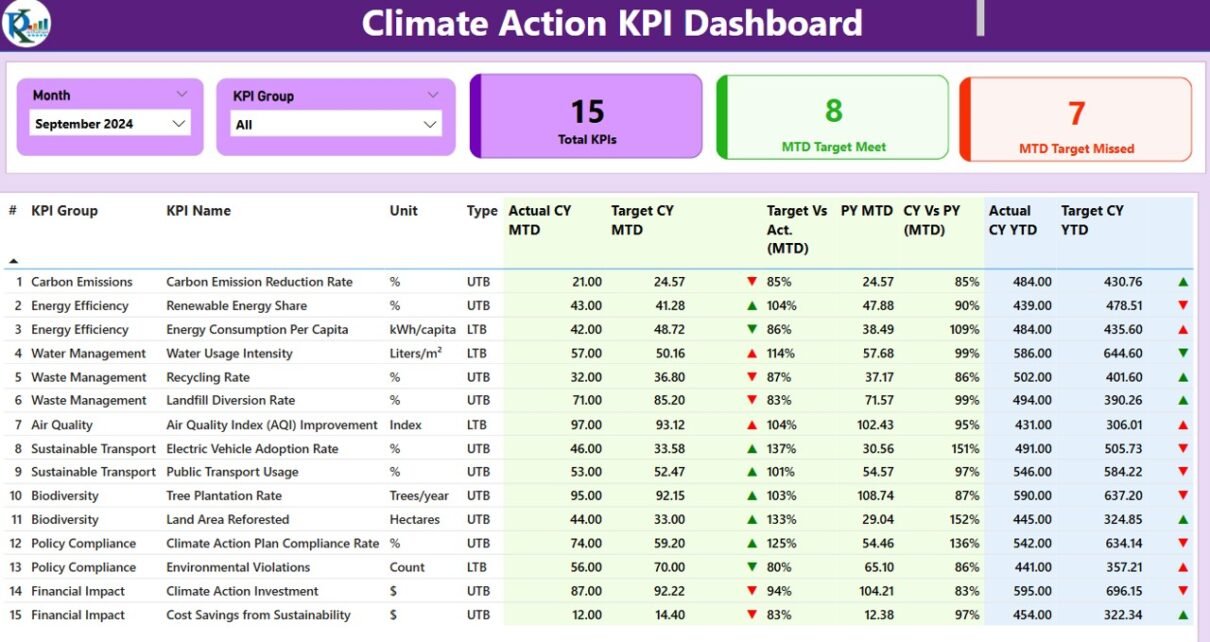
Summary Page:
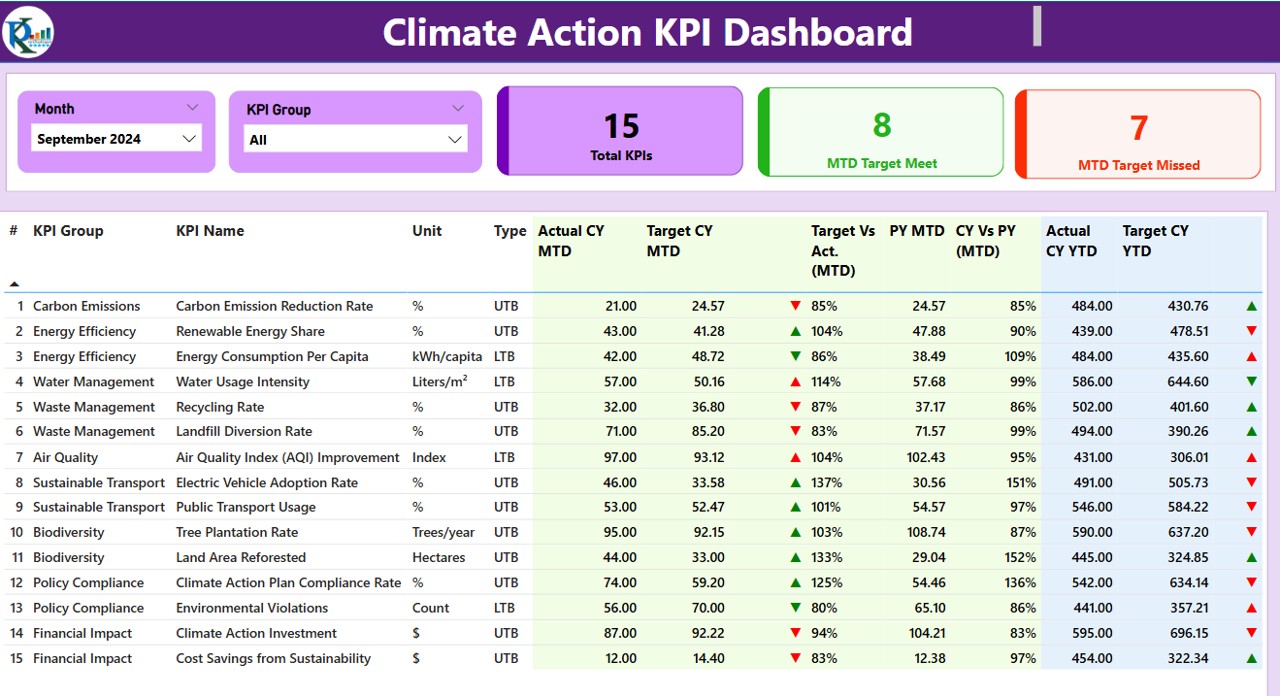
Displays KPI performance, including MTD and YTD targets vs. actuals, KPI trends, and easy-to-read visual indicators.
KPI Trend Page:
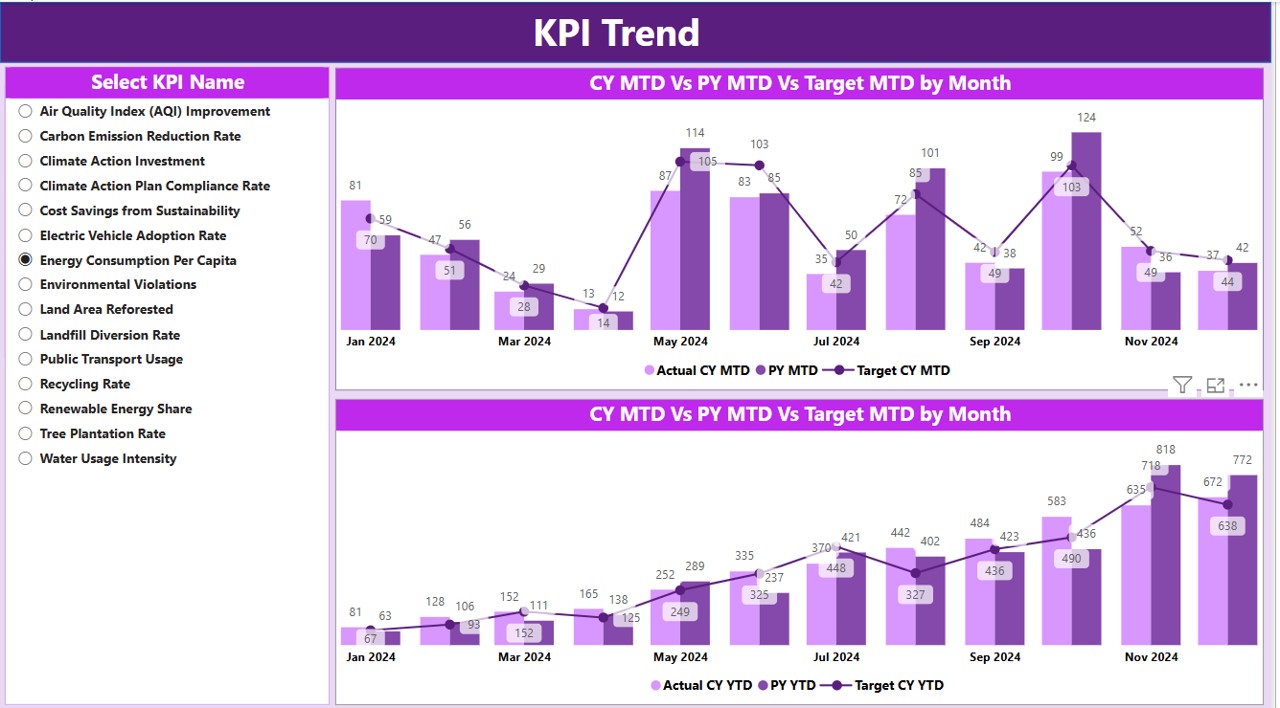
Provides MTD and YTD comparisons with combo charts for detailed analysis.
KPI Definition Page:
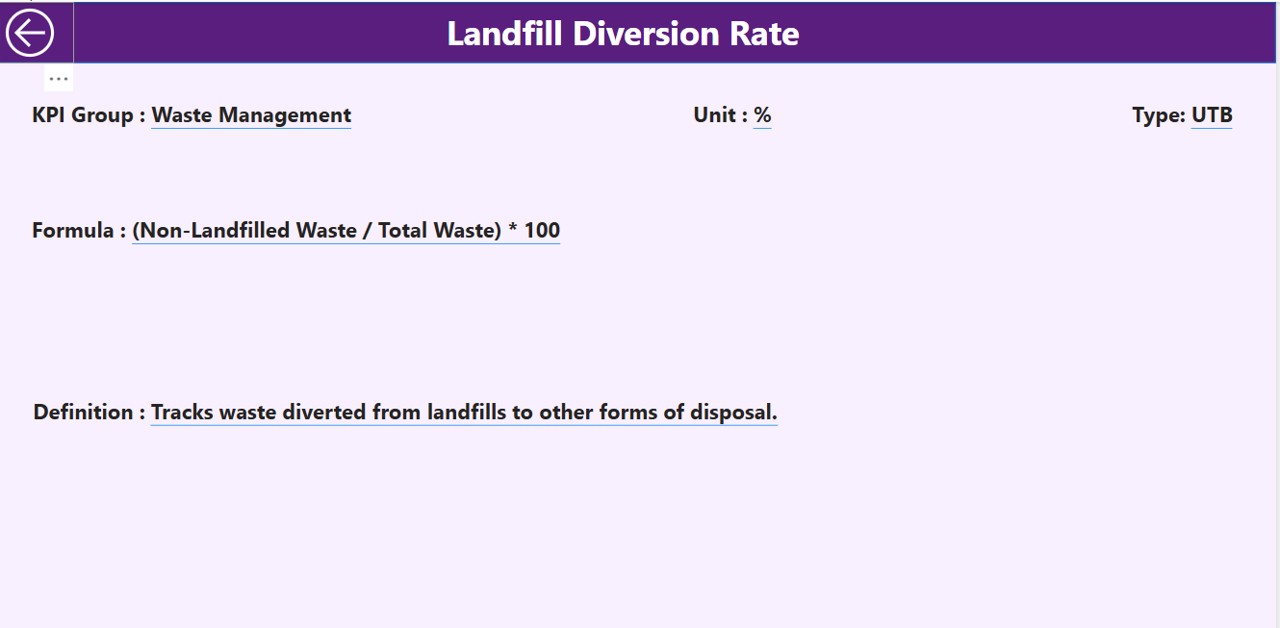
Hidden drill-through page containing KPI formulas and detailed definitions.
Comprehensive KPI Tracking:
- Monitor carbon emissions, energy usage, waste management, and sustainability goals.
- Analyze KPIs using “Lower the Better” (LTB) or “Upper the Better” (UTB) categories.
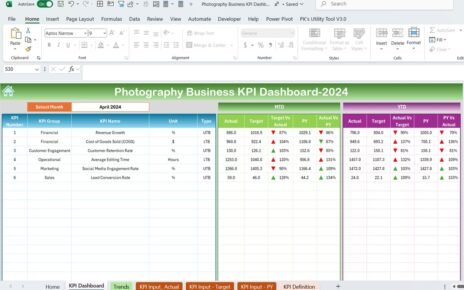
Excel Data Integration:
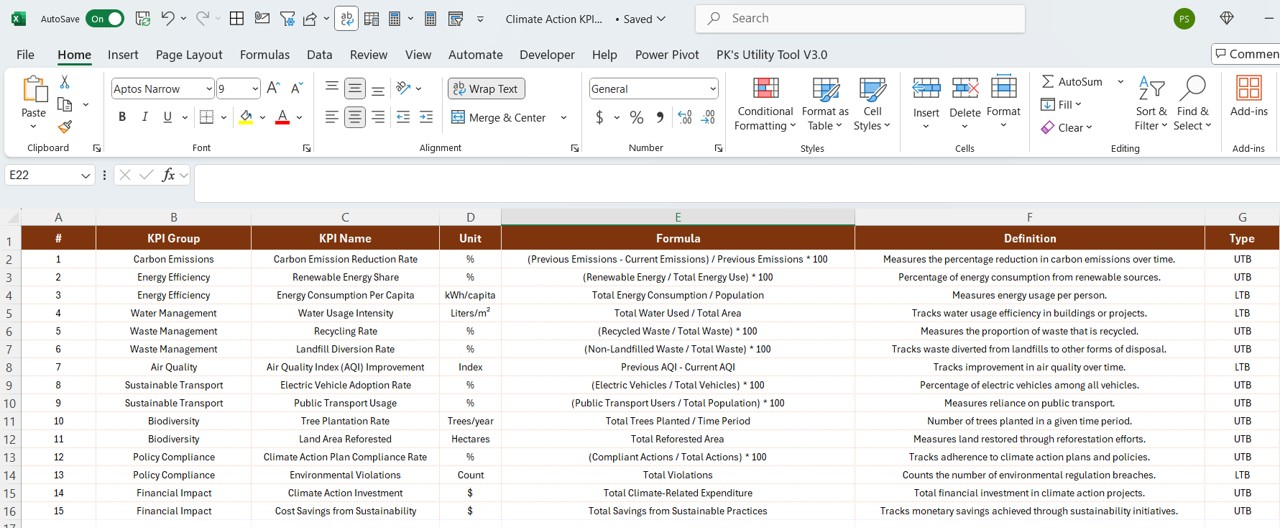
- Easily update KPI data through three structured Excel sheets (Actuals, Targets, and KPI Definitions).
Automated Performance Indicators:
- Color-coded icons (▼/▲) to indicate KPI status (meeting or missing targets).
- Trend comparison of Current vs. Previous Year data for MTD and YTD.
User-Friendly Navigation:
- Interactive slicers to filter KPIs by month and category.
- Drill-through functionality for in-depth KPI insights.