In today’s fast-paced tech environment, ensuring high-quality code is essential to meet user expectations and stay competitive. With the increasing complexity of software applications, managing code quality becomes a challenging but necessary task. This is where Code Quality KPI Dashboards come in. By tracking various key performance indicators (KPIs), these dashboards provide insights into code quality and performance, helping developers, testers, and managers identify areas for improvement.
Key Features of the Code Quality KPI Dashboard
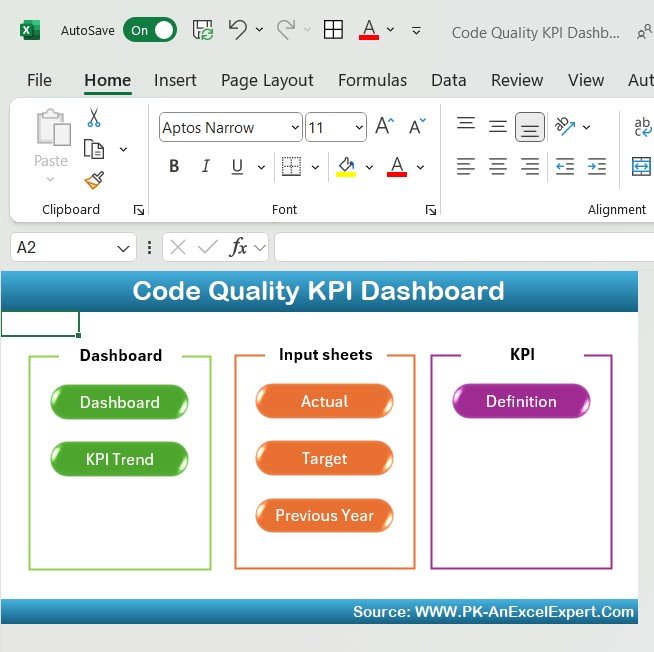
This dashboard comes as a ready-to-use template that can be customized according to your project needs. The Code Quality KPI Dashboard includes seven essential worksheets:
Home Sheet:
This is the index sheet where users can easily navigate to the other sections. It provides six buttons to jump directly to the respective sheets.
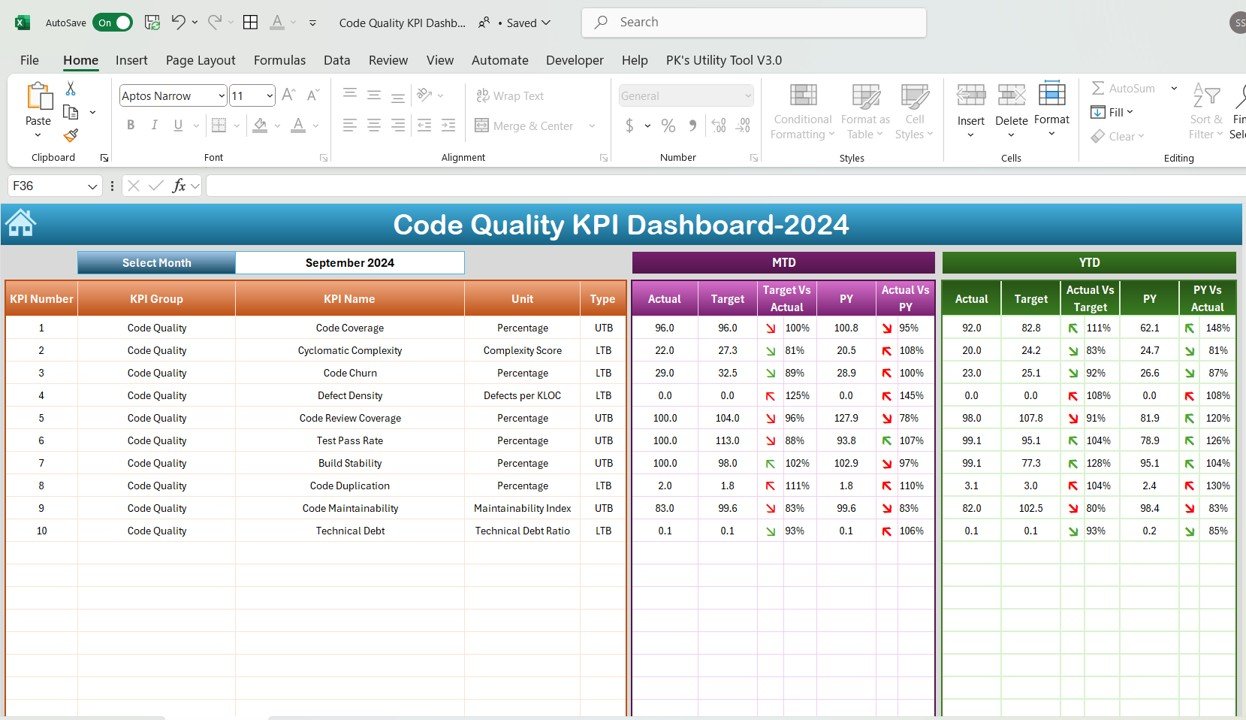
Dashboard Sheet Tab:
This is the main sheet that displays information about all the KPIs. It features a drop-down menu where you can select the month, and the entire dashboard updates with the data for that month. The sheet includes:
- MTD (Month to Date): Actual, Target, and Previous Year (PY) data
- YTD (Year to Date): Actual, Target, and Previous Year data
- Target vs Actual and PY vs Actual comparisons
- Conditional formatting (Up/Down arrows) to highlight performance deviations
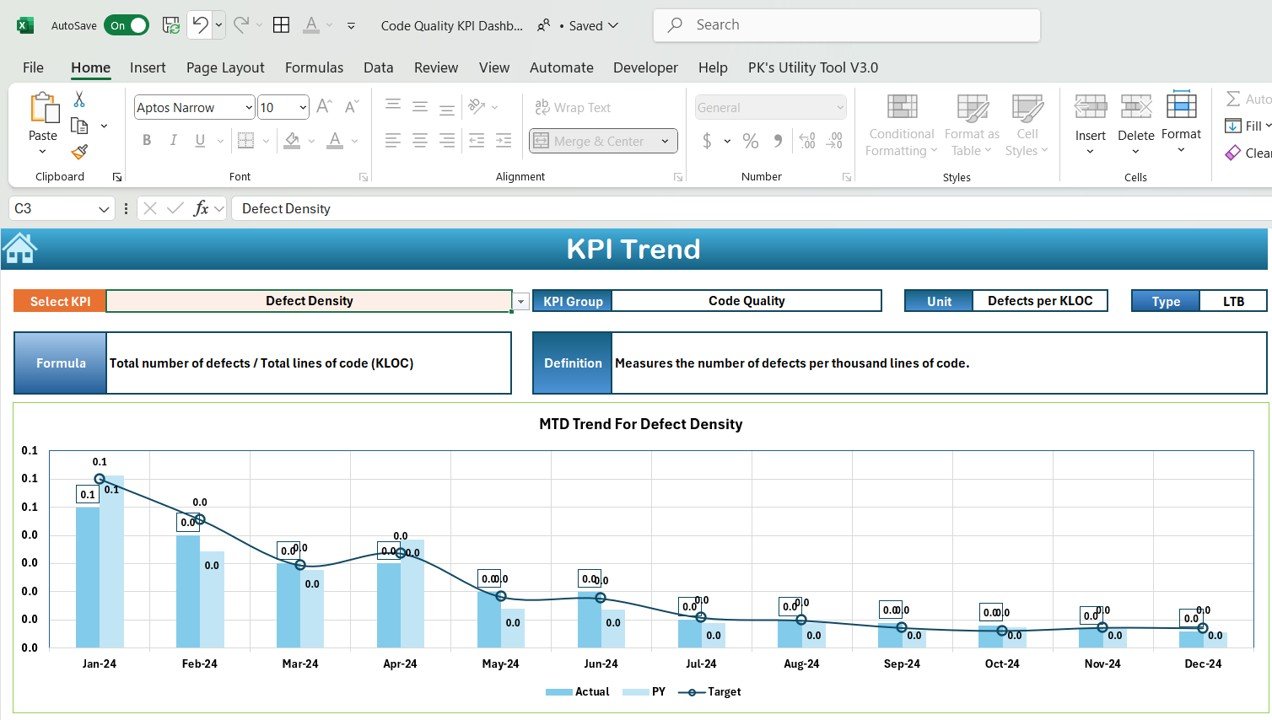
KPI Trend Sheet Tab:
This sheet provides a drop-down menu to select the KPI name. It displays:
- KPI Group
- Unit of KPI
- Type of KPI (Lower the better, Upper the better)
- Formula for KPI calculation
- Definition of each KPI
Actual Number Sheet Tab:
This tab is used to input the actual numbers for both YTD and MTD. It also allows you to change the month for reporting.
Target Sheet Tab:
Here, you enter the target numbers for each KPI for the particular month (MTD and YTD).
Previous Year Number Sheet Tab:
In this sheet, you input the previous year’s numbers to compare with the current year’s performance.
KPI Definition Sheet Tab:
This sheet contains detailed information about each KPI, including: