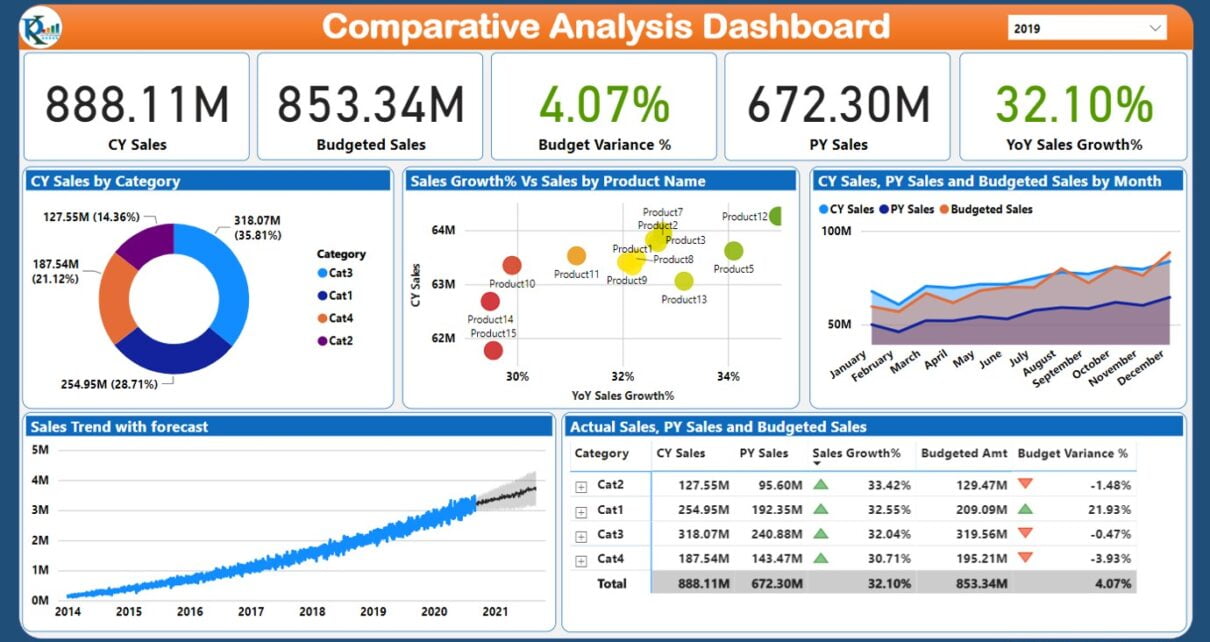
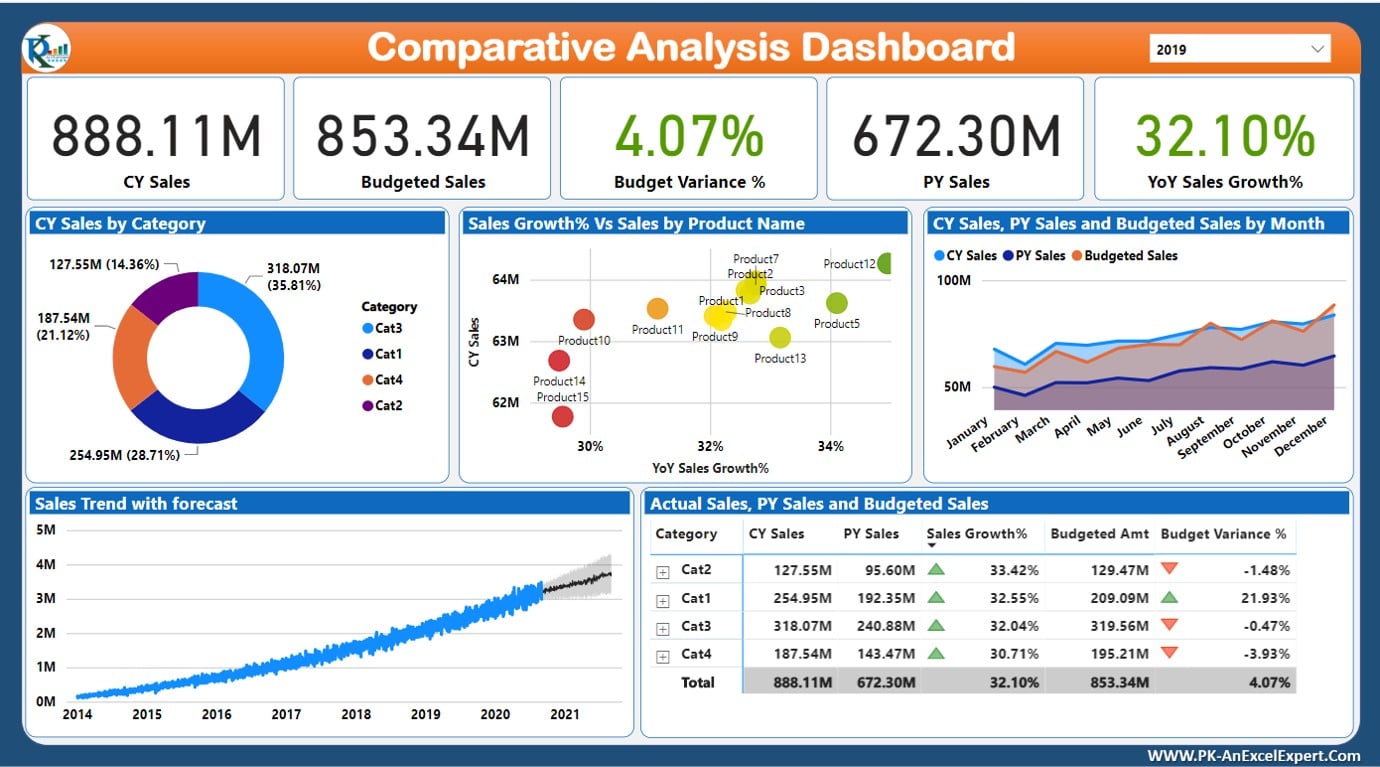
The Comparative Analysis Dashboard in Power BI is a comprehensive tool crafted to offer businesses valuable insights into sales performance over time. By comparing current-year sales against previous years and budget targets, this dashboard reveals growth trends and variances, turning raw data into actionable insights.
Key Features:
- Dynamic Year Selector: Easily filter data by year using the slicer for focused analysis.
- Insightful Visuals: Display current and previous year sales, budget variances, and YoY growth with engaging visuals like doughnut and scatter charts.
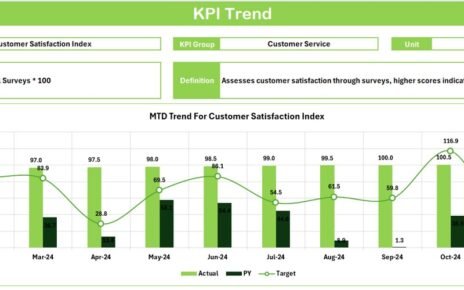
- Trend and Forecast Analysis: Track monthly sales trends, with forecasts providing a forward-looking perspective on sales performance.