Managing construction projects doesn’t have to be overwhelming! Our Construction KPI Dashboard in Power BI is here to make tracking and analyzing project performance a breeze. Designed with simplicity and effectiveness in mind, this dashboard helps you visualize KPIs, spot trends, and make data-driven decisions—all in real time.
Key Features of the Construction KPI Dashboard
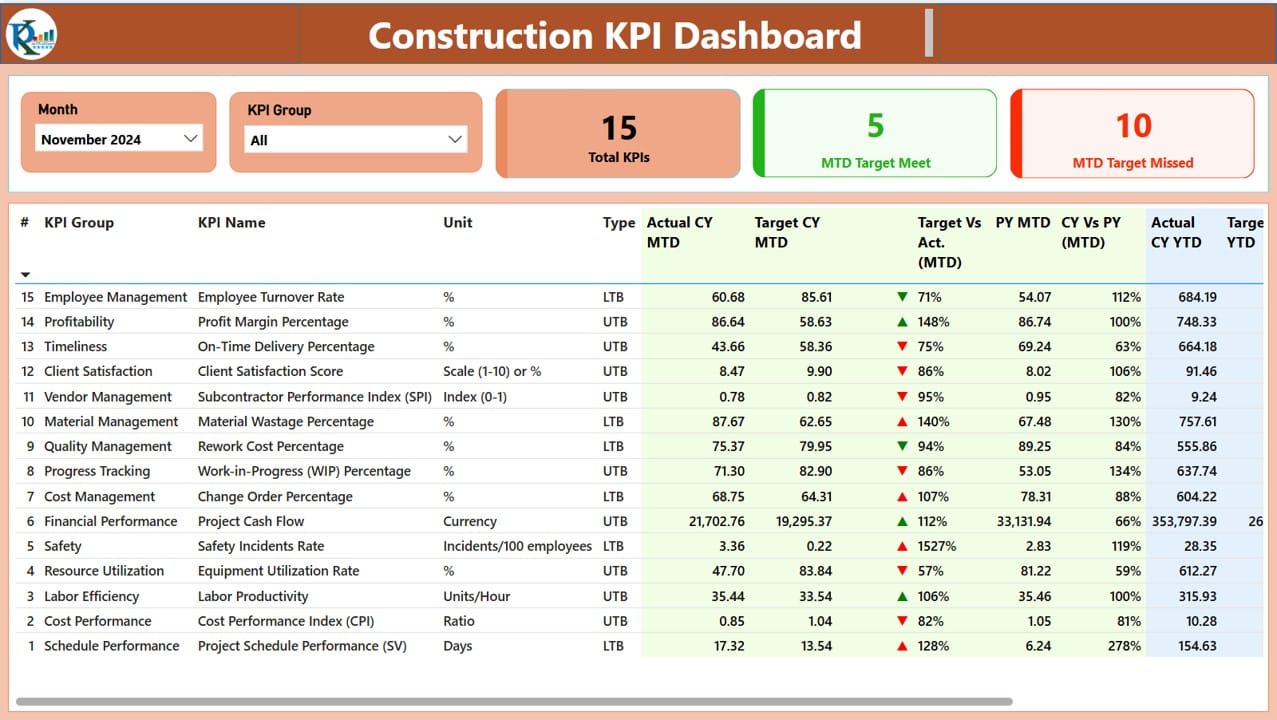
Comprehensive Summary Page
- Filters and slicers to narrow down data by month or KPI group.
- Performance cards displaying total KPIs, MTD Target Met, and MTD Target Missed.
- A detailed table showing KPI metrics, MTD/YTD actuals, targets, and comparisons.
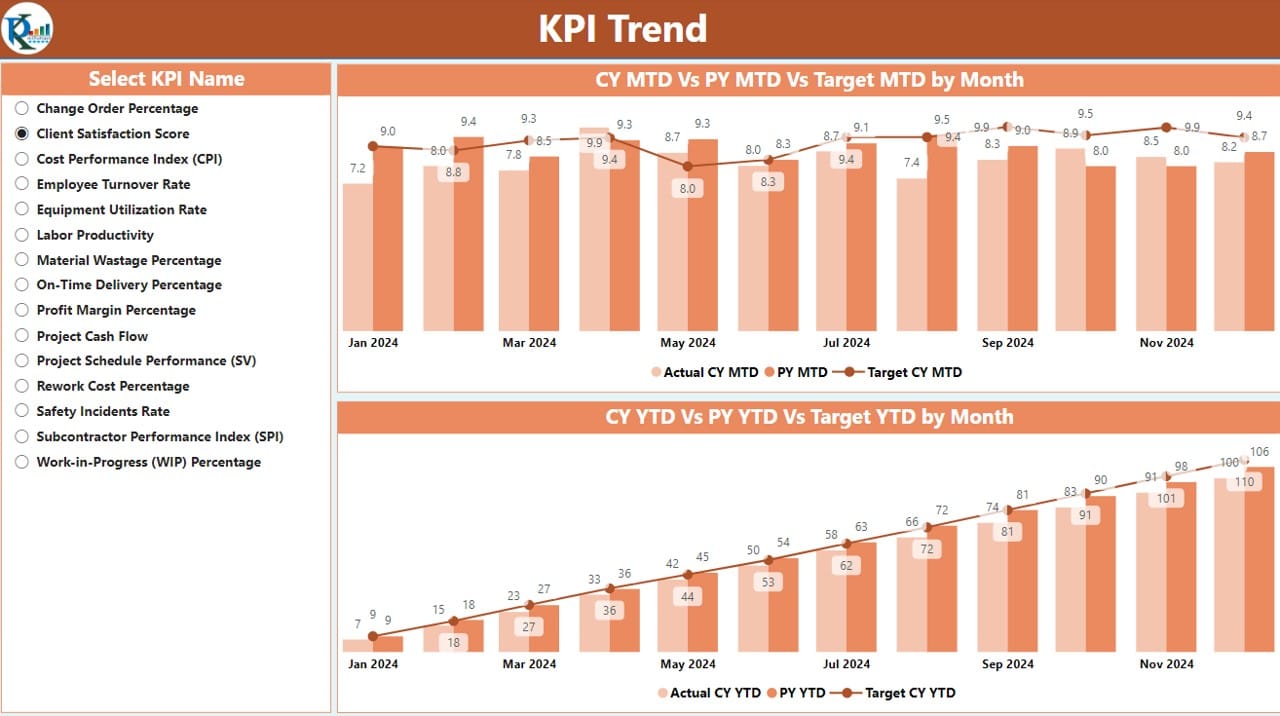
KPI Trend Page
- Combo charts visualizing current year, previous year, and target data for MTD and YTD.
- Slicer functionality to focus on specific KPIs for detailed analysis.
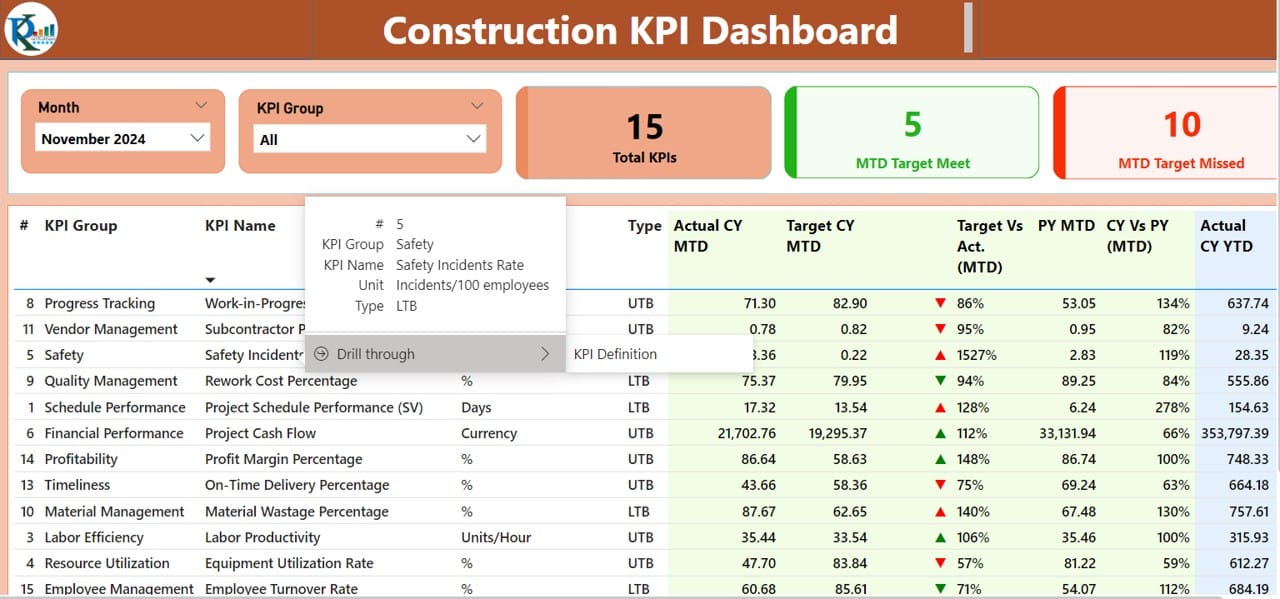
KPI Definition Page
- Drill-through feature for KPI formulas and definitions.
- A convenient back button for seamless navigation.
Excel Integration
- Populate data easily using three sheets: Input_Actual, Input_Target, and KPI Definition.
- Supports real-time updates for accurate and current insights.