Tracking customer experience is crucial for business success, and our Customer Journey Mapping KPI Dashboard in Excel simplifies this process. This ready-to-use, interactive template enables businesses to analyze customer touchpoints, measure key performance indicators (KPIs), and gain actionable insights to enhance customer satisfaction and business growth.
Key Features of the Customer Journey Mapping KPI Dashboard:
Home Sheet (Index Page):
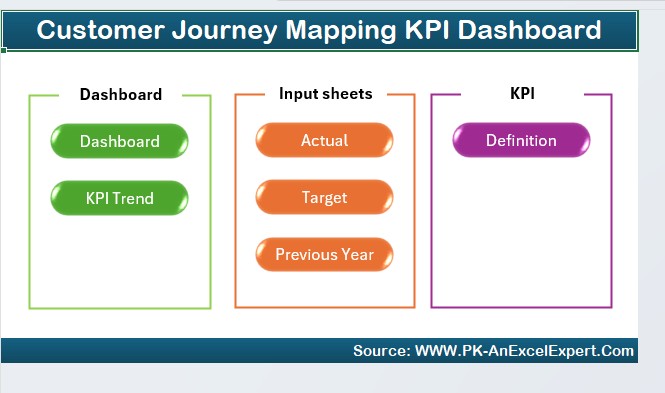
- A centralized navigation hub with 6 quick-access buttons to different dashboard sections.
Dashboard Sheet Tab (Main KPI Overview):
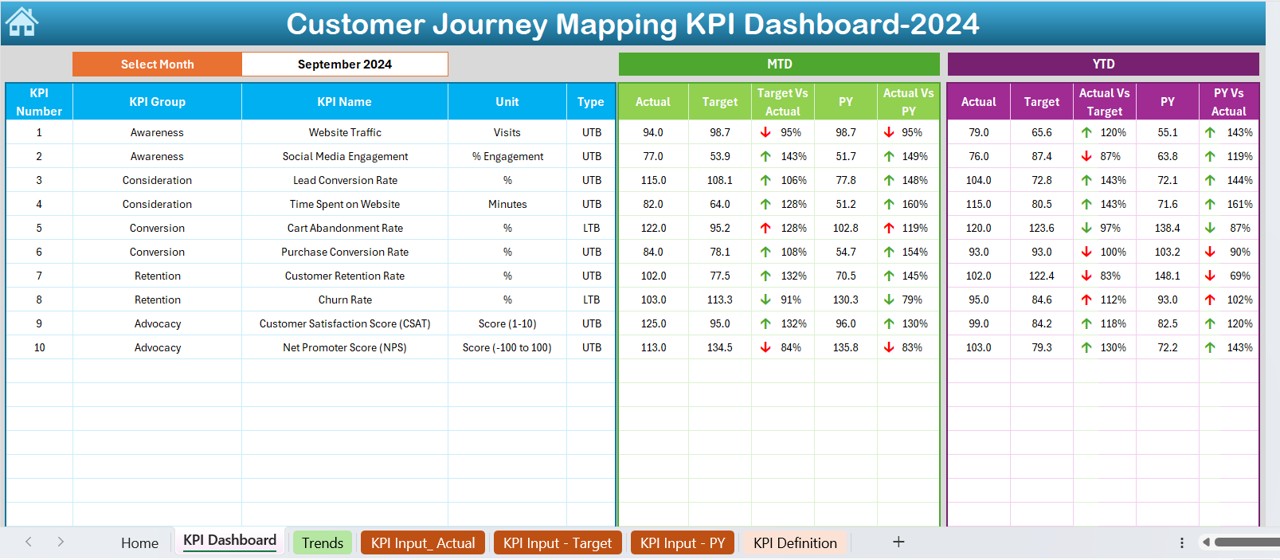
- Dynamic drop-down to select the month (D3) and update all KPI data.
- Displays MTD and YTD actuals, targets, and previous year (PY) data.
- Conditional formatting with up/down arrows for quick performance insights.
KPI Trend Sheet Tab:
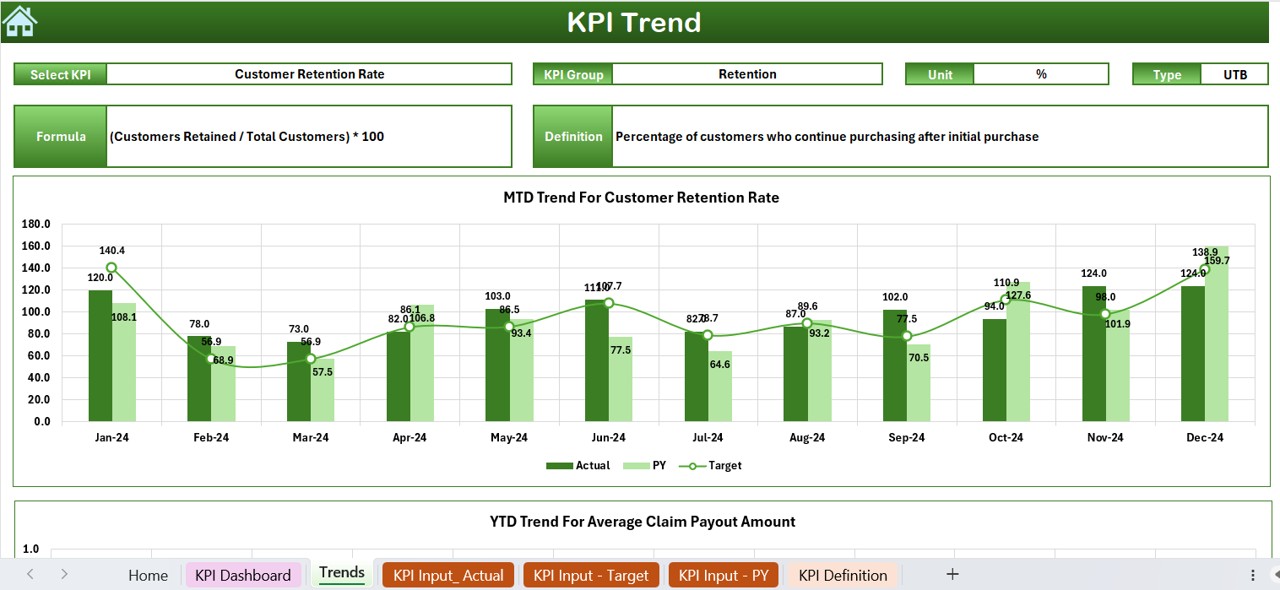
- Select KPI from a drop-down (C3) for detailed performance analysis.
- View KPI Group, Unit, Performance Type (Lower or Upper is Better), Formula, and Definition.
- Trend charts for MTD and YTD Actual, Target, and PY data.
Actual Numbers Input Sheet:
- Input actual KPI values for each month.
- Change reference month (E1) to adjust reporting.
Target Sheet Tab:
- Set target values for MTD and YTD performance tracking.
Previous Year Numbers Sheet Tab:
- Stores historical KPI data for year-over-year comparison.
KPI Definition Sheet Tab:
- Clearly defines each KPI with name, group, unit, formula, and definition for easy reference.