The Customer Lifetime Value KPI Dashboard in Excel is a powerful and easy-to-use template designed to track and analyze customer value over time. This dashboard provides a comprehensive view of key performance indicators (KPIs), helping businesses make data-driven decisions to enhance customer retention and maximize revenue. With dynamic visualizations and automated calculations, this ready-to-use tool simplifies KPI tracking for improved business strategies.
Key Features of the Customer Lifetime Value KPI Dashboard
7 Well-Structured Worksheets:
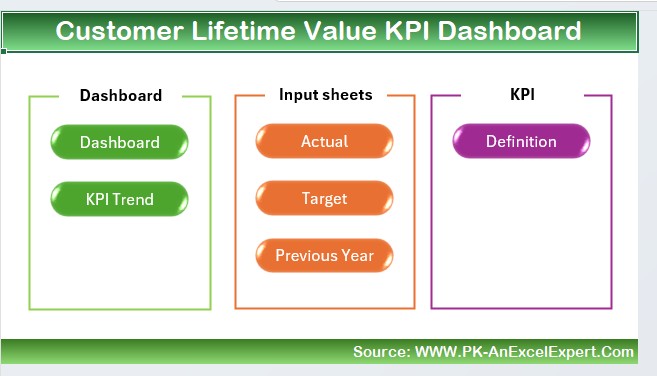
Organized sections for seamless data management.
Interactive Dashboard Sheet:
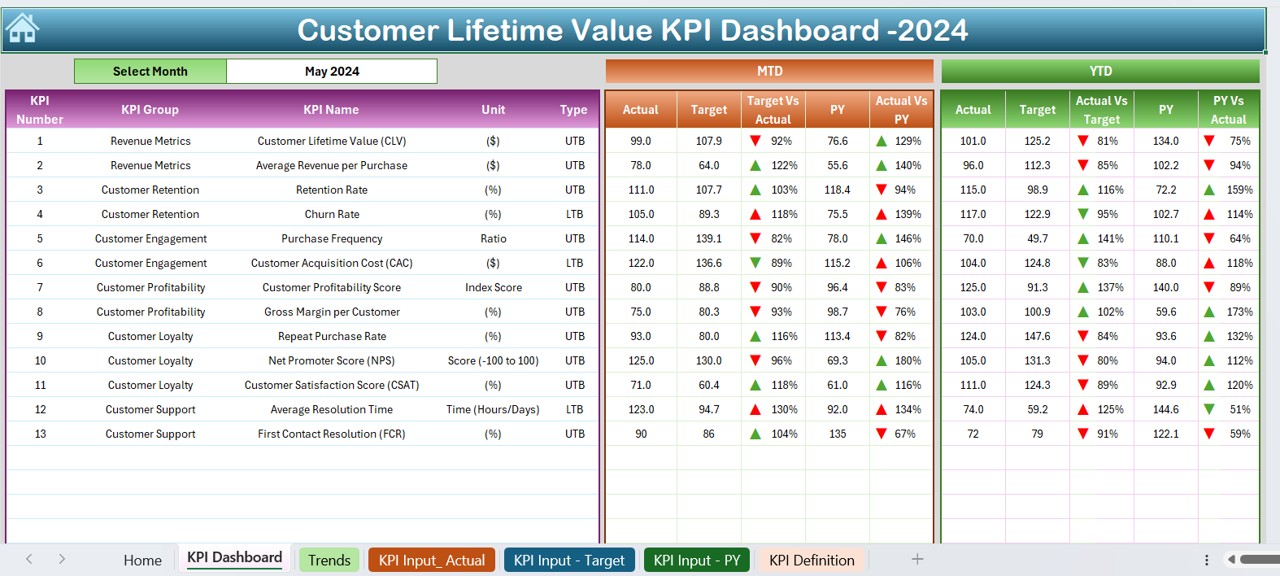
Select any month from the dropdown (D3) to update MTD & YTD KPIs dynamically.
Trend Analysis Charts:
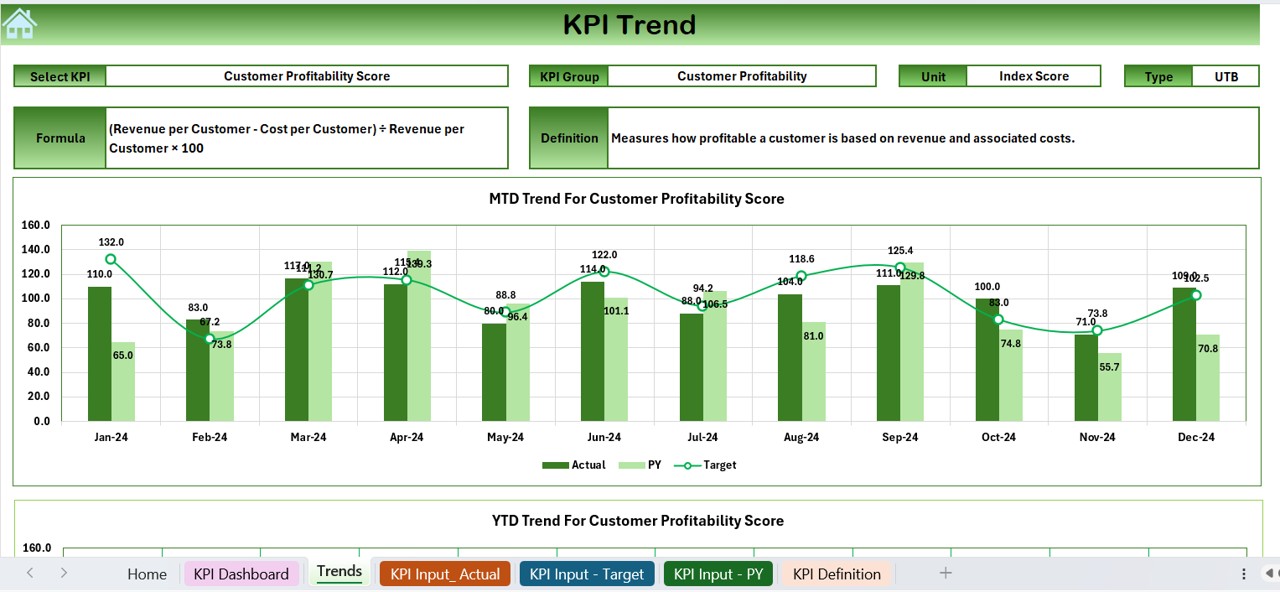
Track actual, target, and previous year data with clear up/down indicators.
Data Input Sheets:
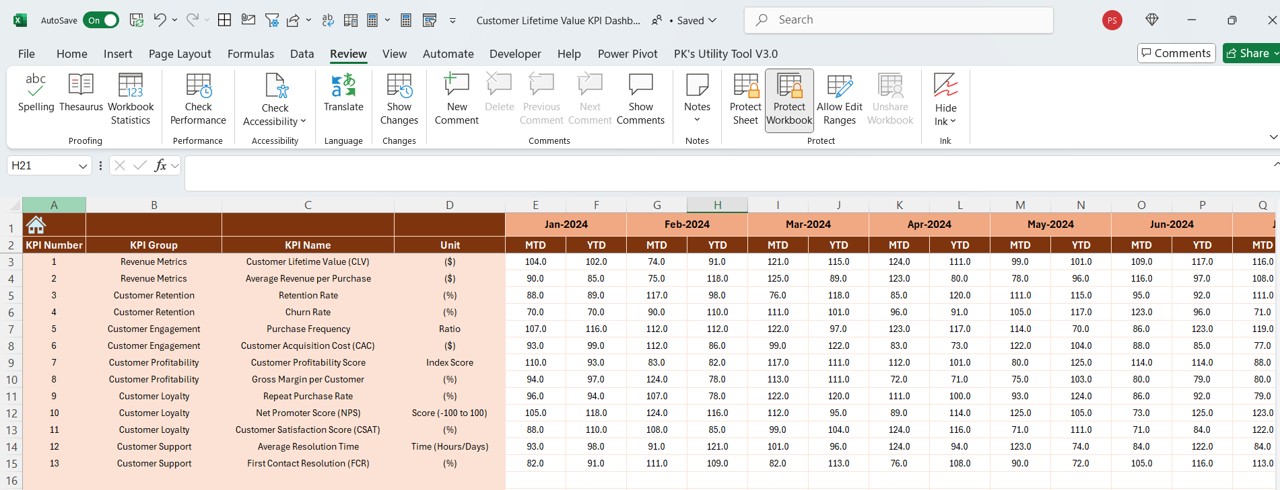
Enter actual numbers, target values, and previous year data effortlessly.
KPI Definition Sheet:
Maintain KPI names, formulas, and definitions for clarity.
Conditional Formatting:
Highlights performance gaps with automatic up/down arrows.
Fully Customizable:
Modify KPI definitions, targets, and formulas based on business needs.