The Cybersecurity Incident KPI Dashboard in Excel is a powerful and ready-to-use tool designed to help organizations track and manage critical cybersecurity metrics. This professional-grade template offers a comprehensive solution for monitoring key performance indicators (KPIs) to ensure robust incident response and security performance.
Key Features of the Cybersecurity Incident KPI Dashboard
Home Sheet:
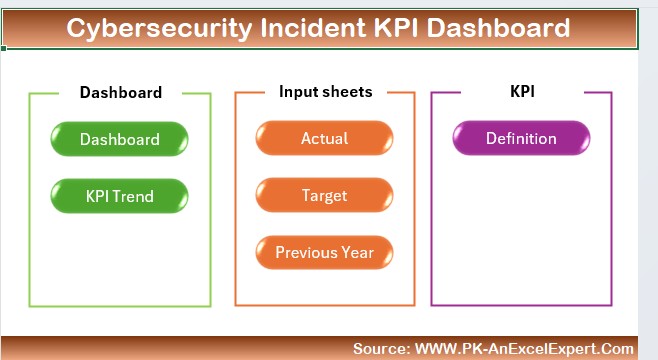
- Centralized navigation with six interactive buttons for easy access to all sheets.
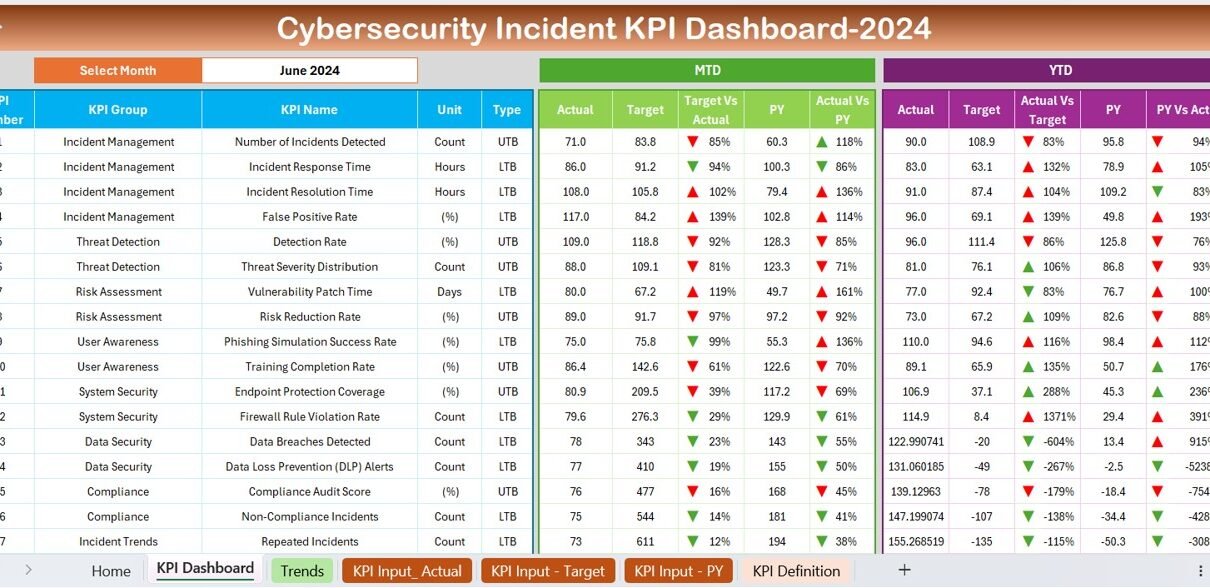
Dashboard Sheet Tab:
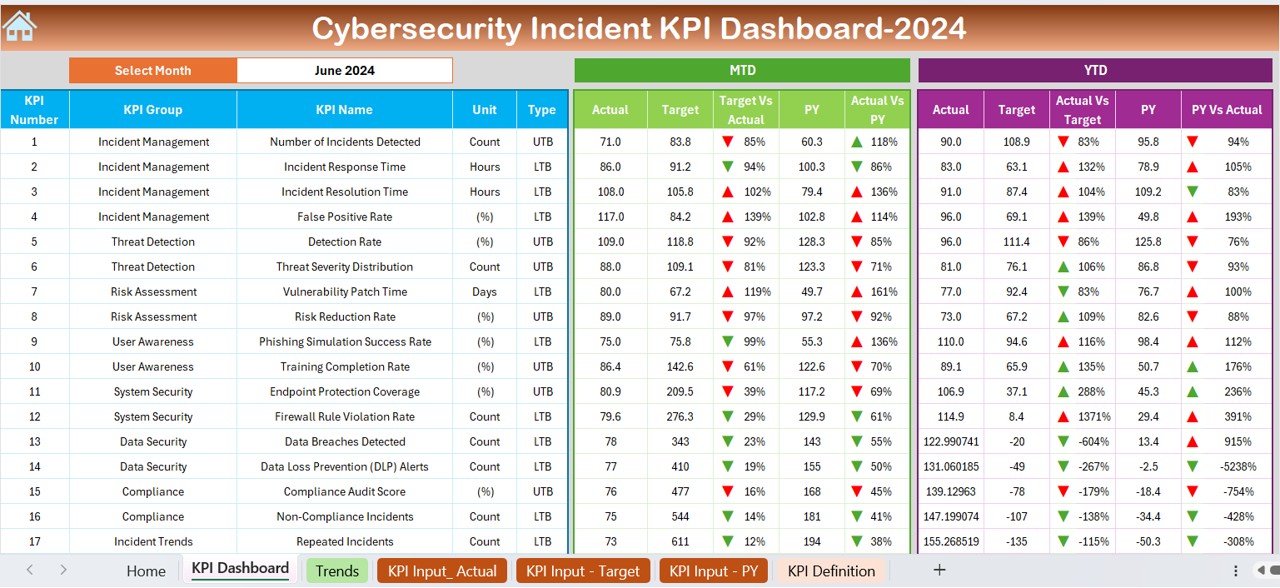
- Displays month-specific KPIs with dynamic dropdowns.
- Provides comparisons such as Target vs Actual and PY vs Actual with conditional formatting and visual indicators.
- Includes both MTD and YTD data analysis.
KPI Trend Sheet Tab:
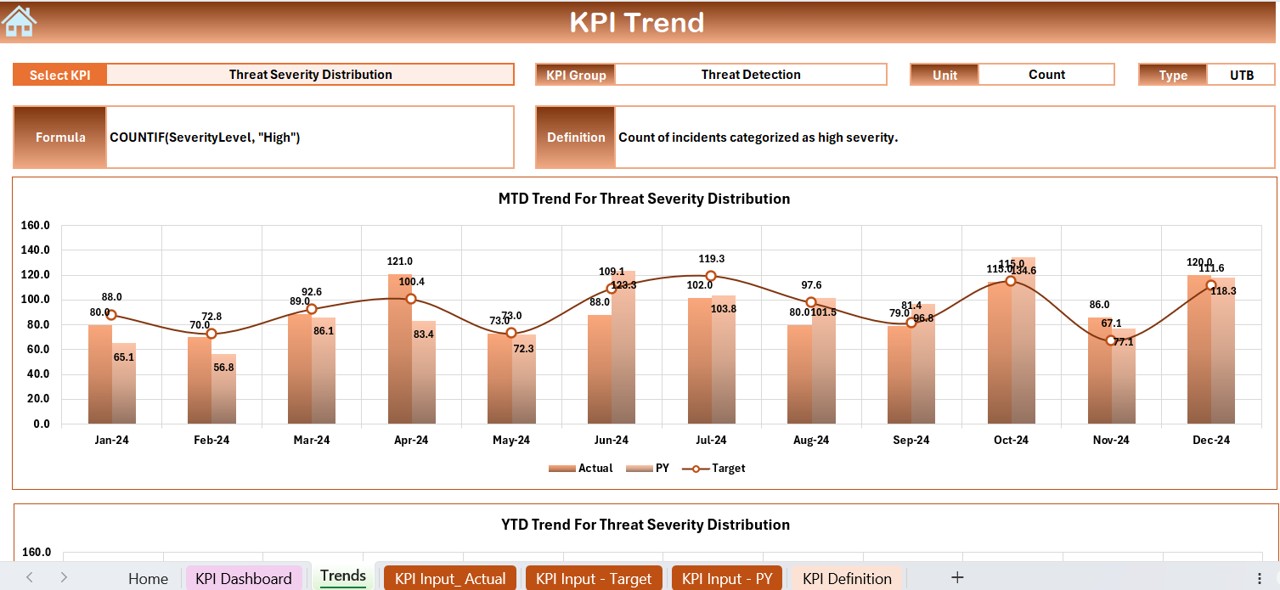
- Allows selection of specific KPIs to view detailed trends.
- Shows KPI Group, Unit, Type (Lower the Better/Upper the Better), Formula, and Definition.
- Provides trend charts for MTD and YTD metrics.
Actual Numbers Input Sheet:
- Input fields for recording monthly and yearly actual values.
- Month selector for dynamic data entry based on the fiscal year.
Target Sheet Tab:
- Sections to input monthly and yearly targets for all KPIs.
Previous Year Numbers Sheet Tab:
- Stores historical data to facilitate year-over-year performance comparisons.
KPI Definition Sheet Tab:
- Comprehensive details for each KPI, including its name, group, unit, formula, and definition.