The Dealer Network KPI Dashboard in Excel is a ready-to-use and professionally designed template that enables businesses to track and analyze the performance of their dealer networks efficiently. This user-friendly dashboard simplifies KPI management with pre-built features, interactive elements, and customizable options, empowering businesses to make data-driven decisions.
Key Features of the Dealer Network KPI Dashboard
Home Sheet
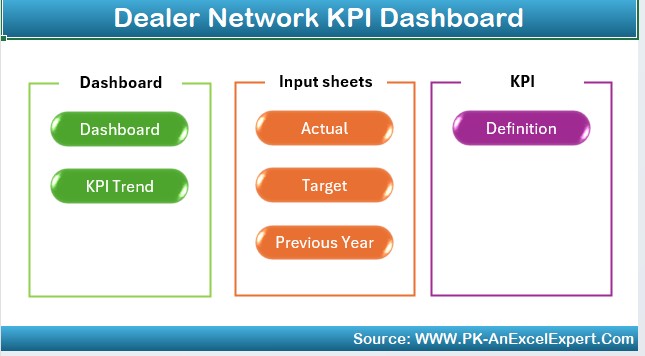
- A centralized navigation hub with six buttons for quick access to key sections.
Dashboard Sheet Tab
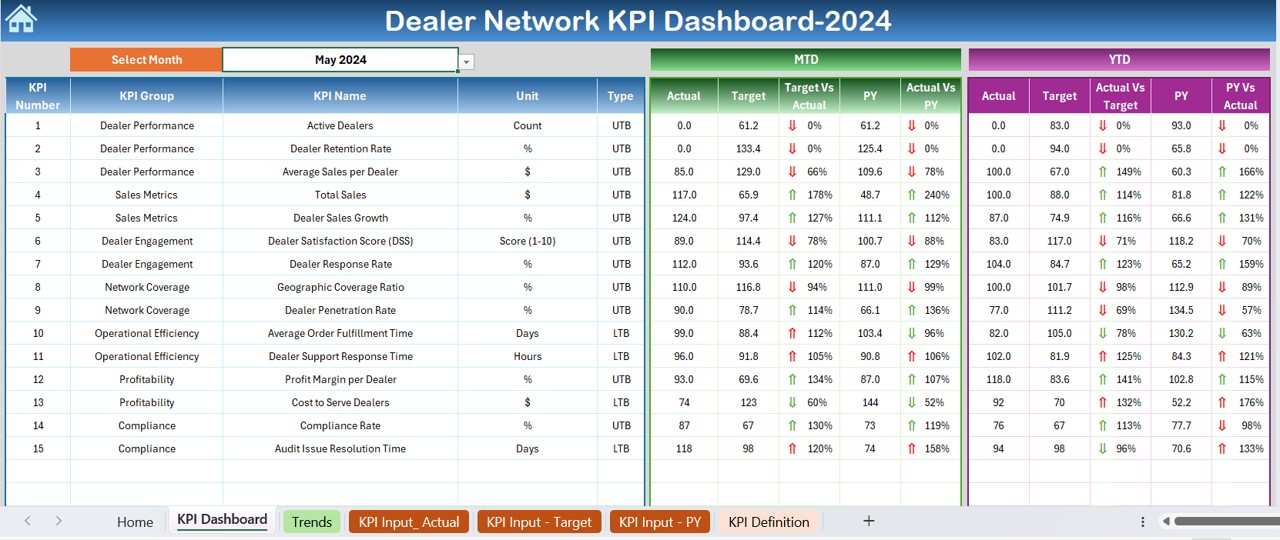
- Dynamic month selection updates all data for the chosen month.
- Comprehensive display of MTD and YTD actuals, targets, and previous year comparisons with visual cues like up/down arrows for trend analysis.
KPI Trend Sheet Tab
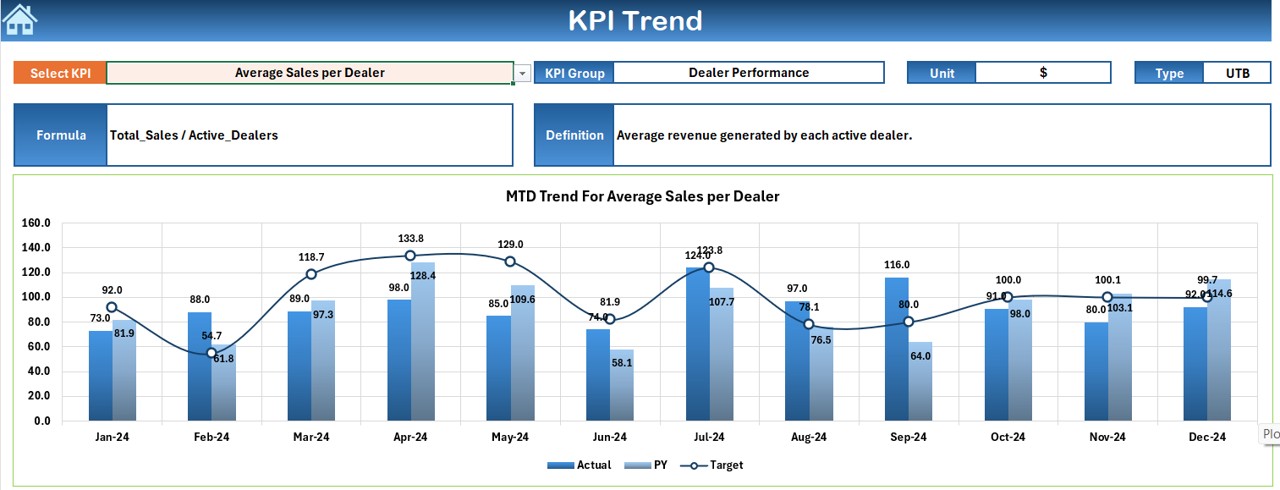
- Interactive dropdown to view detailed information about individual KPIs, including their group, unit, formula, and definition.
- MTD and YTD trend charts for actuals, targets, and previous year values.
Actual Numbers Input Sheet
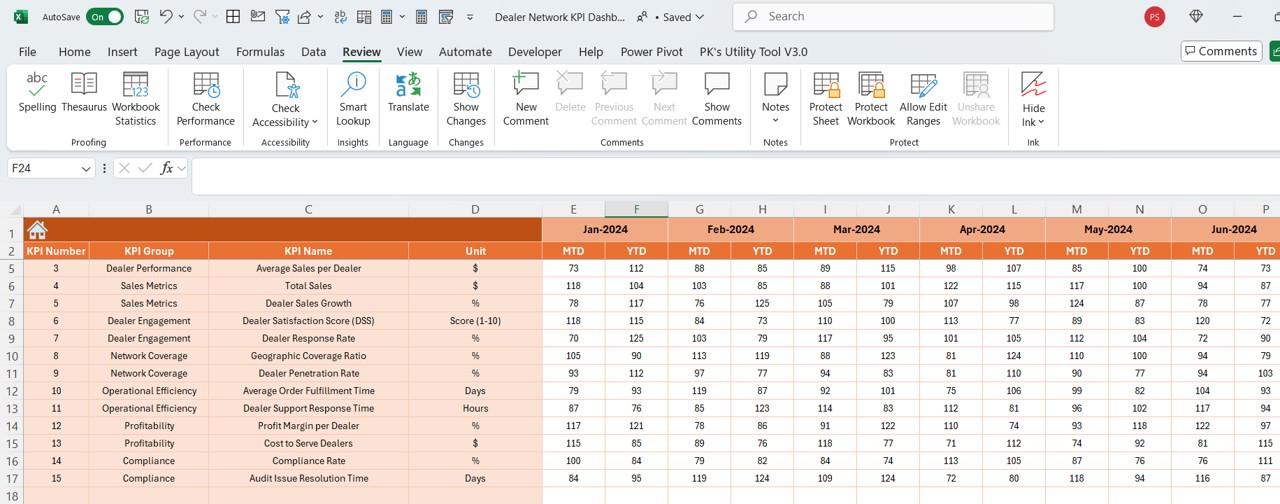
- Allows seamless input of MTD and YTD actual performance numbers, with adjustable month settings.
Target Sheet Tab
- Dedicated space for entering monthly and yearly performance targets for each KPI.
Previous Year Numbers Sheet Tab
- Organized data entry for previous year’s performance figures to enable year-over-year comparisons.
KPI Definition Sheet Tab
- Comprehensive KPI details, including name, group, unit, formula, and definition for easy reference and tracking.