Managing financial leverage is crucial for businesses, and our Debt-to-Equity Ratio KPI Dashboard in Excel is designed to simplify this process. This ready-to-use template provides real-time insights into financial stability by tracking key debt and equity metrics. With automated calculations, visual dashboards, and structured worksheets, this tool helps businesses make informed financial decisions effortlessly.
Key Features:
Home Sheet:
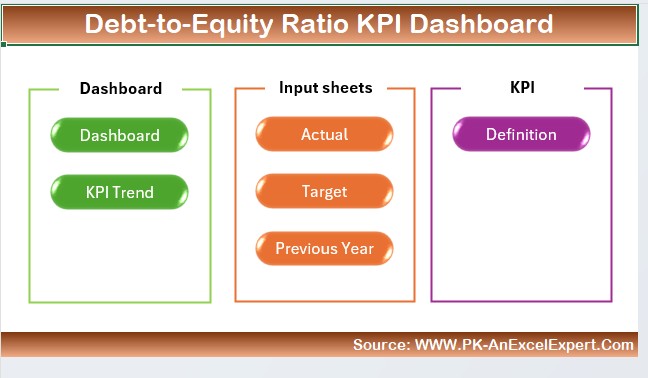
A central navigation hub with quick-access buttons to different sections of the dashboard.
Dashboard Sheet:
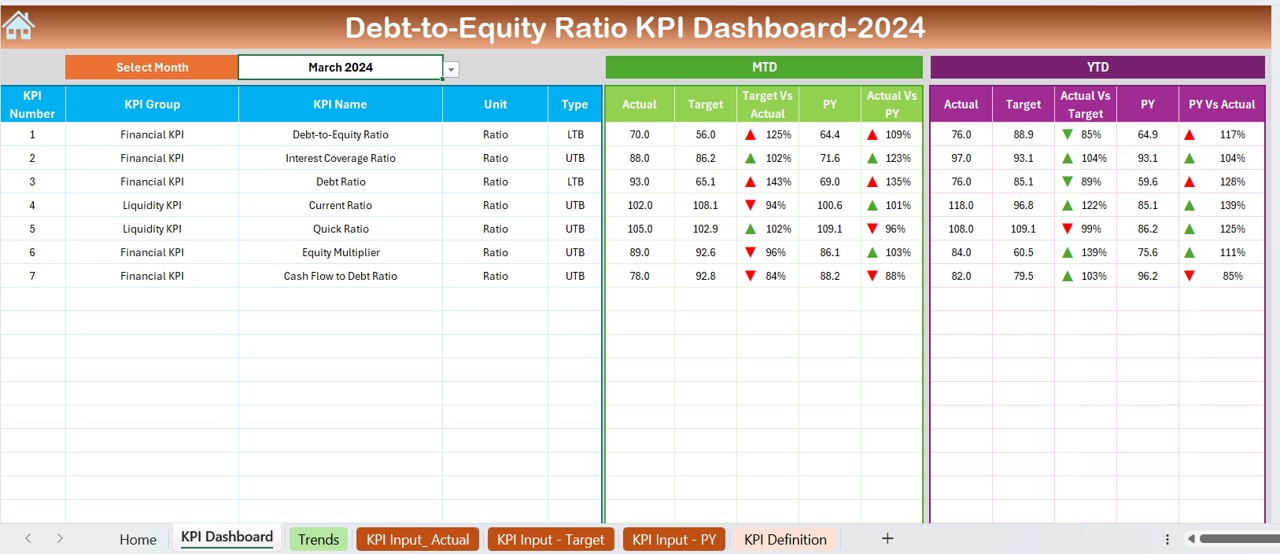
A comprehensive view displaying MTD (Month-To-Date) and YTD (Year-To-Date) financial metrics, including Actual, Target, and Previous Year data, with dynamic conditional formatting for easy trend analysis.
KPI Trend Sheet:
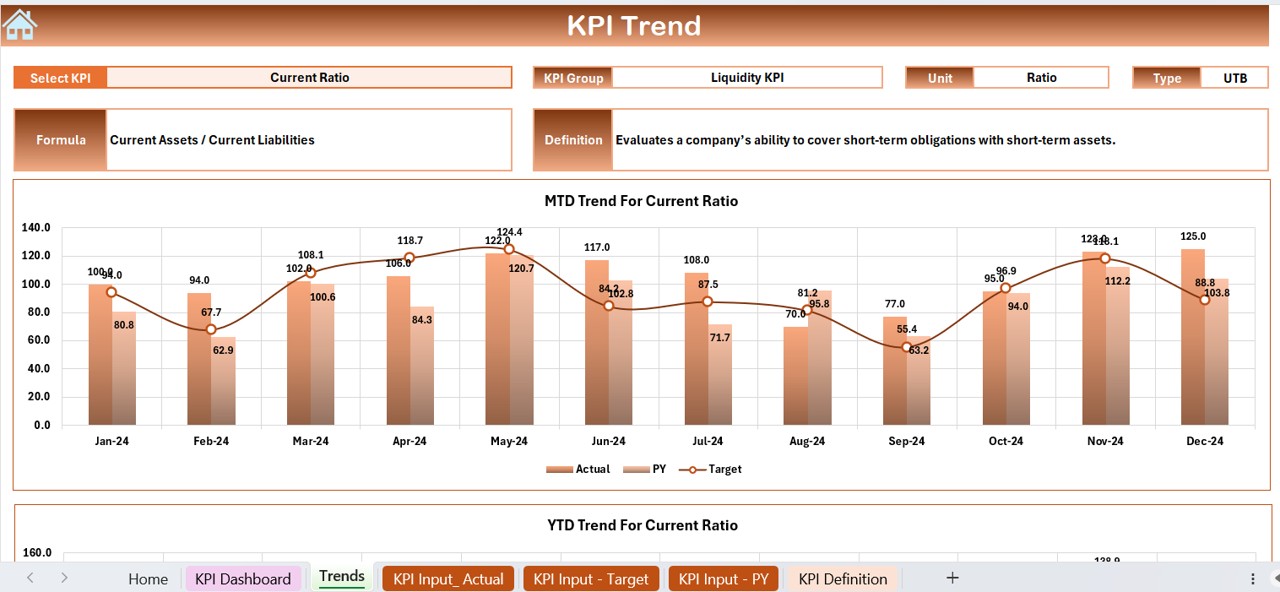
Allows users to select a KPI and view its group, unit, type (Lower/Upper is Better), formula, and definition, along with trend charts for MTD and YTD.
Actual Numbers Input Sheet:
A dedicated space for entering real-time MTD and YTD figures, with an option to set the starting month dynamically.
Target Sheet:
Enables users to set monthly and yearly KPI targets for accurate performance tracking.
Previous Year Data Sheet:
Stores historical data for easy comparison with current performance metrics.
KPI Definition Sheet:
A structured sheet to maintain KPI names, units, formulas, and definitions for clarity and reference.