The Distributor Performance KPI Dashboard in Excel is a versatile and user-friendly tool designed to help businesses monitor and improve the efficiency of their distributor operations. This ready-to-use template simplifies KPI tracking, enabling better decision-making and streamlined performance analysis.
Key Features
Home Sheet:
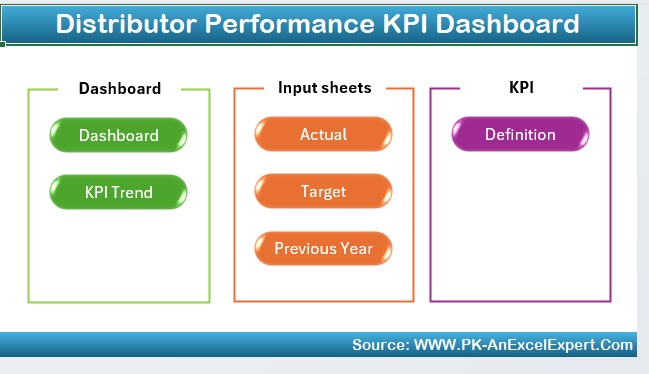
- A centralized index with 6 navigation buttons for seamless access to other sheets.
Dashboard Sheet:
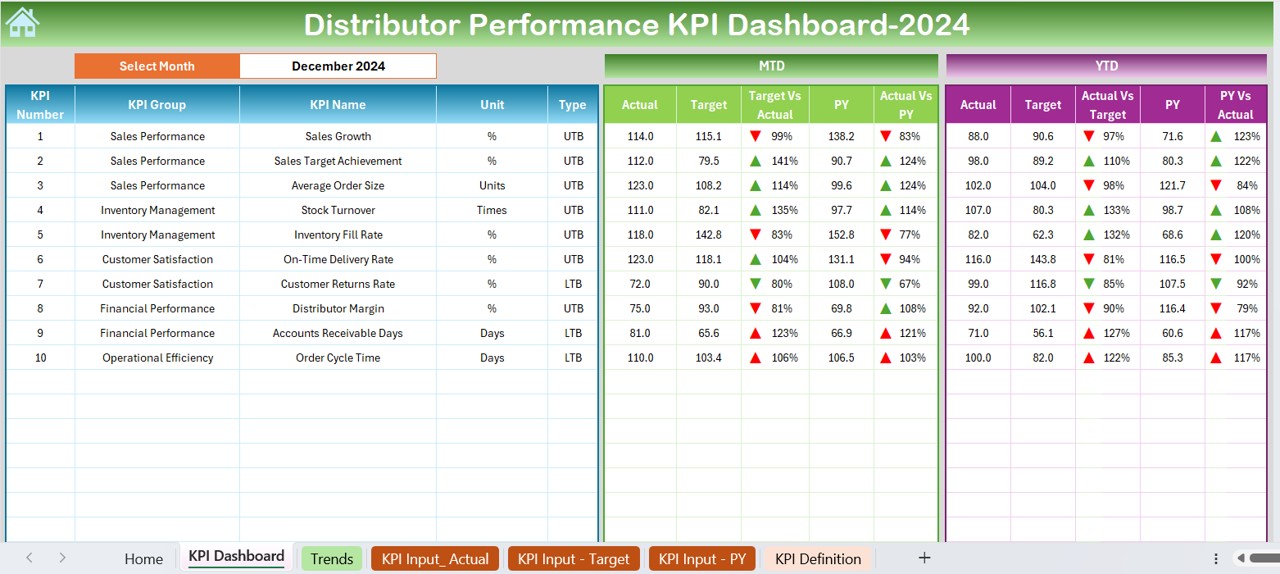
- Displays MTD and YTD metrics with conditional formatting for trends and a month selector to view data dynamically.
KPI Trend Sheet:
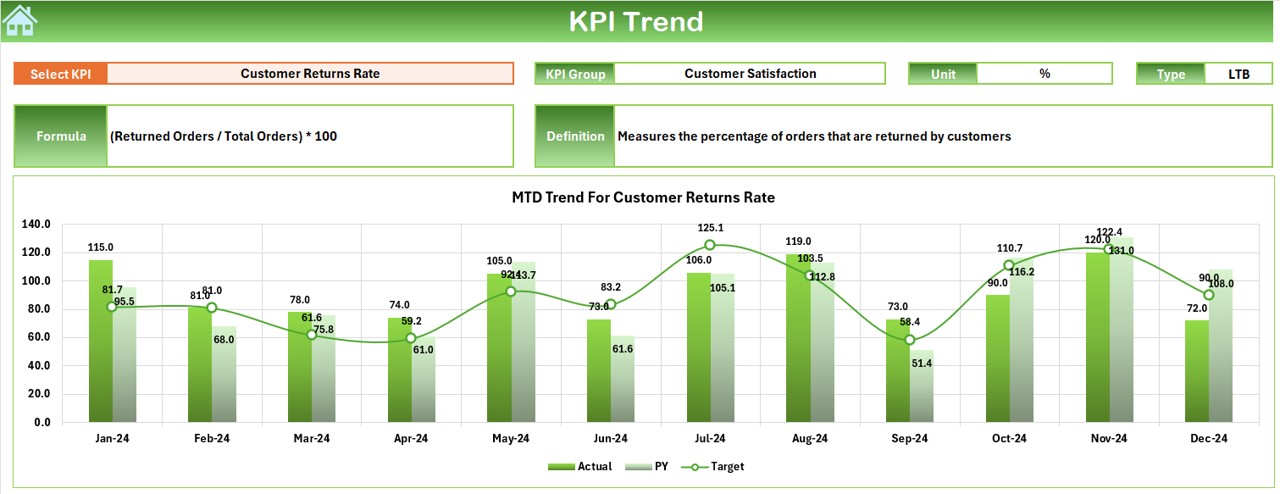
- Provides detailed KPI analysis, including definitions, formulas, and trend charts for MTD and YTD performance.
Actual Numbers Input Sheet:
- Simplifies data entry for actual performance numbers with dynamic updates based on the selected month.
Target Sheet:
- Allows input of MTD and YTD target values for clear goal-setting and tracking.
Previous Year Number Sheet:
- Enables easy benchmarking with prior year’s data for comparative analysis.
KPI Definition Sheet:
- Comprehensive space to define and document KPI details, including group, unit, formula, and definition.