Unlock the potential of your organization’s diversity and inclusion strategy with our ready-to-use Diversity and Inclusion KPI Dashboard in Excel. This comprehensive tool is designed to help businesses track, measure, and visualize the effectiveness of their D&I initiatives through clear and actionable insights.
Key Features of the Diversity and Inclusion KPI Dashboard
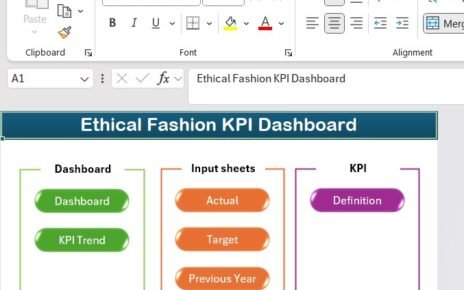
Seven Specialized Worksheets:
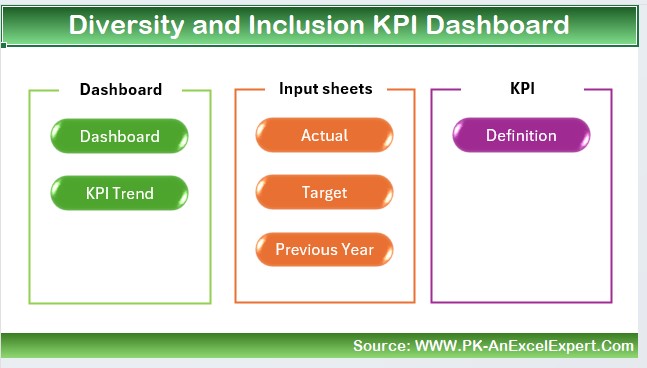
- Each worksheet serves a specific function, from the Home sheet with navigation buttons for easy access to other sections, to detailed data input and analysis tabs.
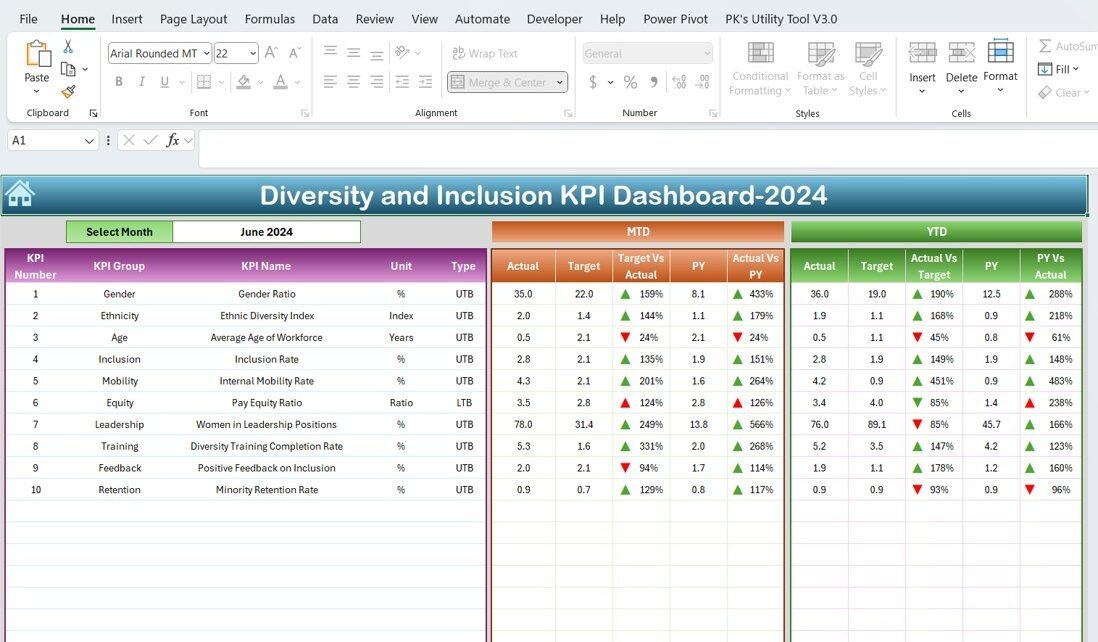
Dashboard Sheet:
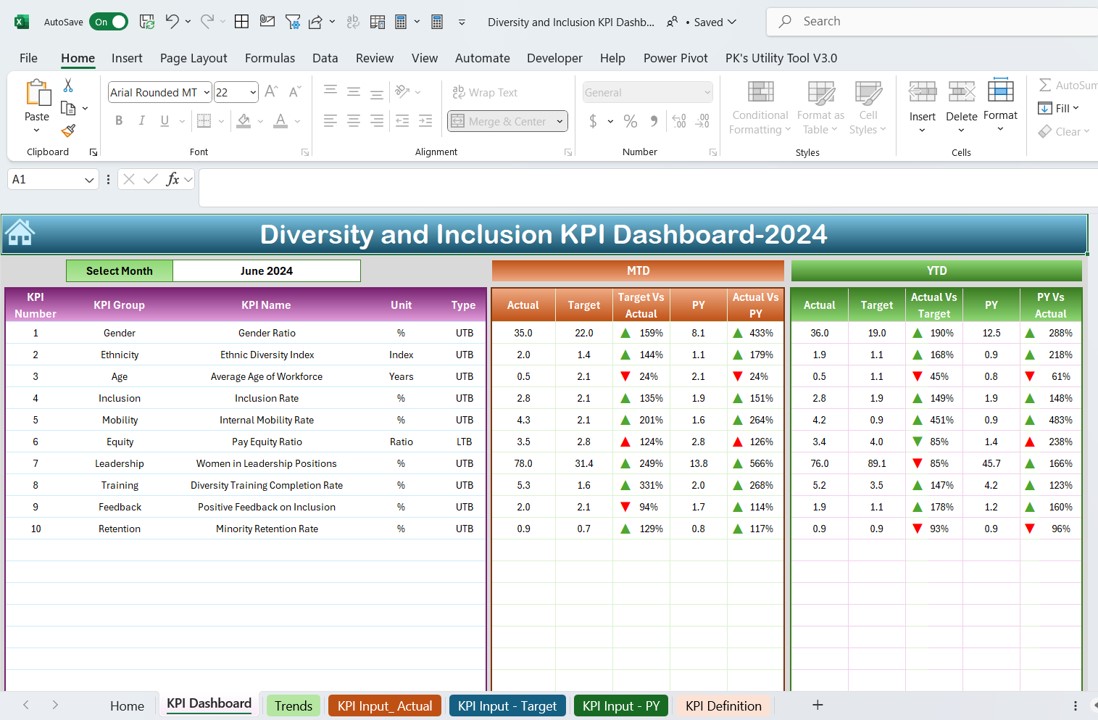
- The main hub where you can select the reporting month from a dropdown menu, updating all related KPI data to reflect month-to-date and year-to-date comparisons with previous year’s data. Enjoy intuitive visualizations like conditional formatting arrows that indicate performance trends.
KPI Trend Sheet:
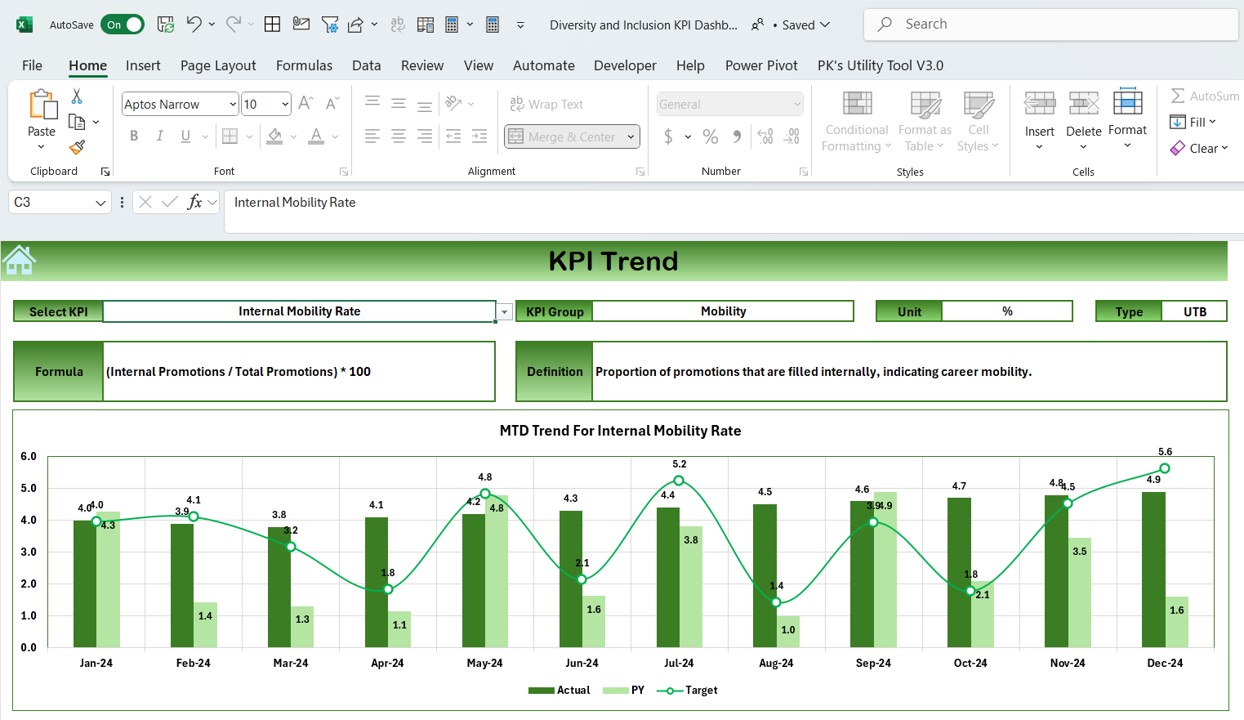
- Select a KPI and view its metrics, including type, unit, and formula, along with visual MTD and YTD trend charts comparing actuals to targets and previous year figures.
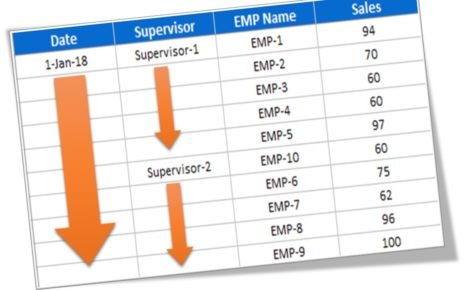
Input Sheets:
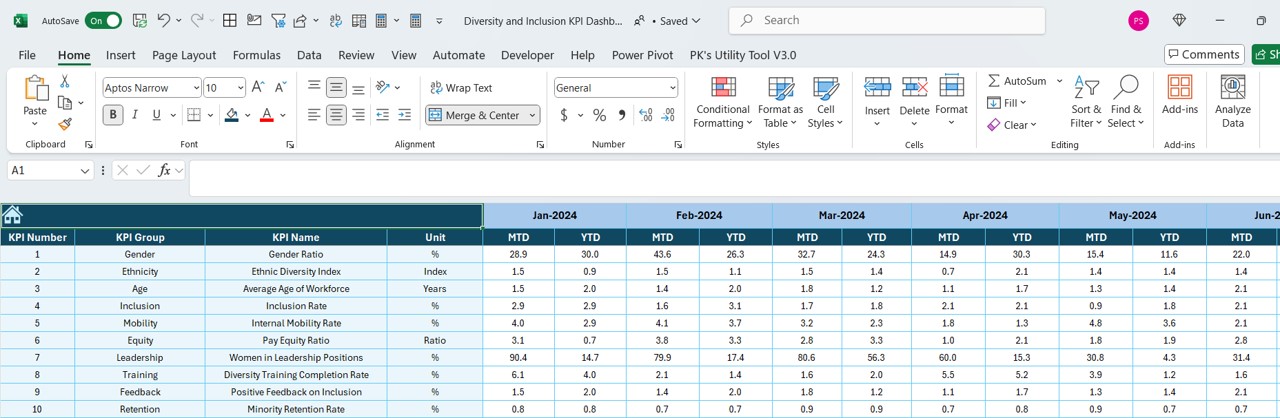
- Dedicated tabs for entering actual, target, and previous year numbers ensure your data is comprehensive and up-to-date, providing a robust foundation for accurate reporting and analysis.
KPI Definition Sheet:
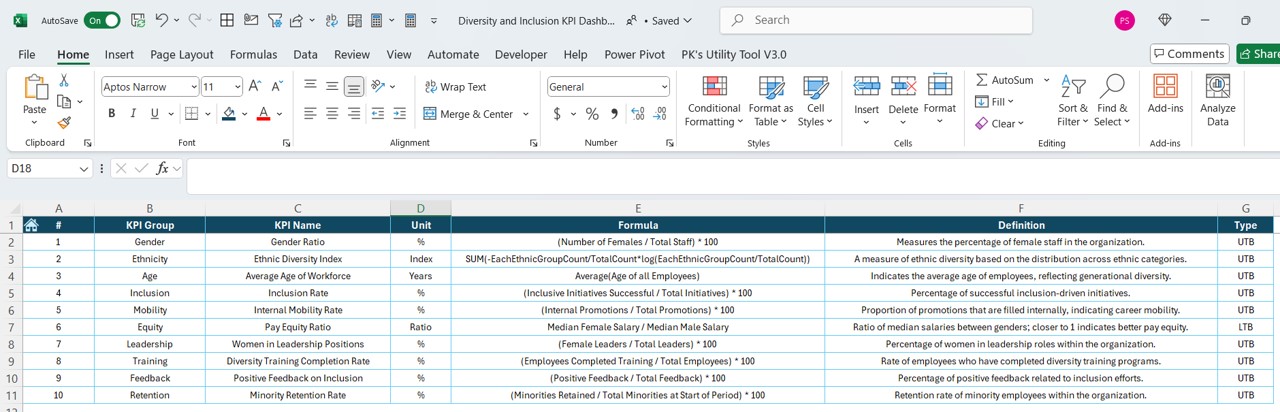
- A glossary-like section where KPIs are clearly defined with their respective formulas and groupings, making it easy for all users to understand and report on D&I metrics effectively.