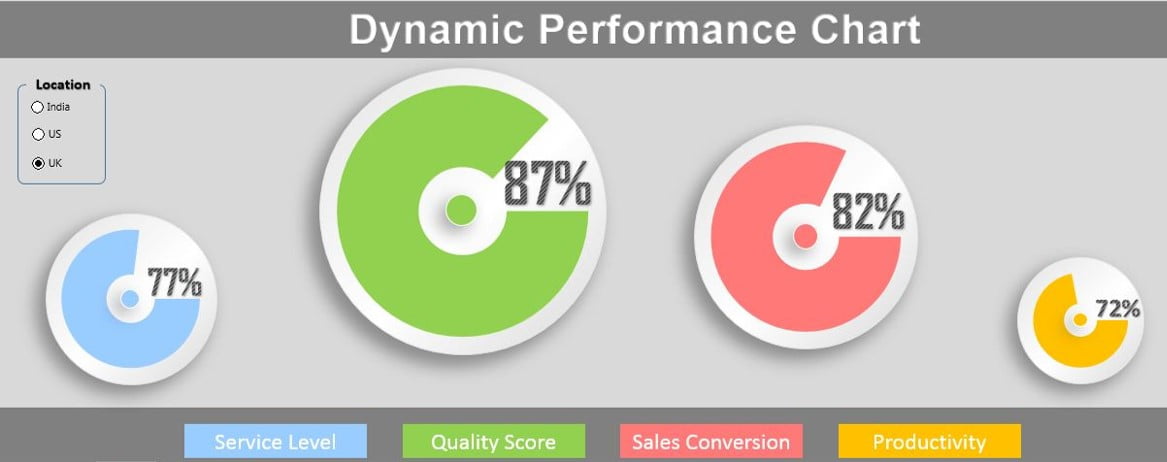
Elevate your data analysis with our Dynamic Performance Chart in Excel. This ready-to-use tool features interactive form controls, dynamic ranges, and real-time updates, making it easy to track and visualize performance metrics. Navigate extensive data with scroll bars and quickly adjust data points with spin buttons for a seamless and efficient experience.
Dynamic Performance Chart in Excel
20
Jun 2024
10Comments Off on Dynamic Performance Chart in Excel
PK
Meet PK, the founder of PK-AnExcelExpert.com! With over 15 years of experience in Data Visualization, Excel Automation, and dashboard creation. PK is a Microsoft Certified Professional who has a passion for all things in Excel. PK loves to explore new and innovative ways to use Excel and is always eager to share his knowledge with others. With an eye for detail and a commitment to excellence, PK has become a go-to expert in the world of Excel. Whether you're looking to create stunning visualizations or streamline your workflow with automation, PK has the skills and expertise to help you succeed. Join the many satisfied clients who have benefited from PK's services and see how he can take your Excel skills to the next level!
https://www.pk-anexcelexpert.com
Related Articles
Excel Template with Protection and Validation
We often required an Excel Template to send some persons or teams so that they can enter the data in
Dynamic chart for Top Selected Employees with GROUPBY and TAKE function
In today's fast-paced business environment, visual data representation has become an indispensable tool for decision-making and performance analysis. One effective
Dynamic Variance Arrows Chart with Check Boxes
In this article, we have created a Dynamic Chart with Variance Arrows using multiple check boxes. This is quite useful