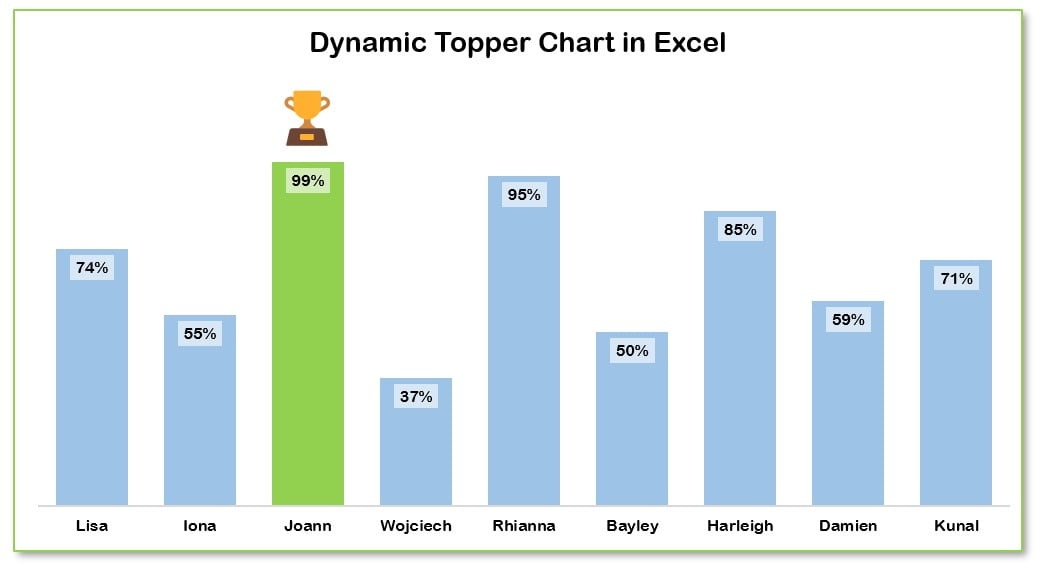
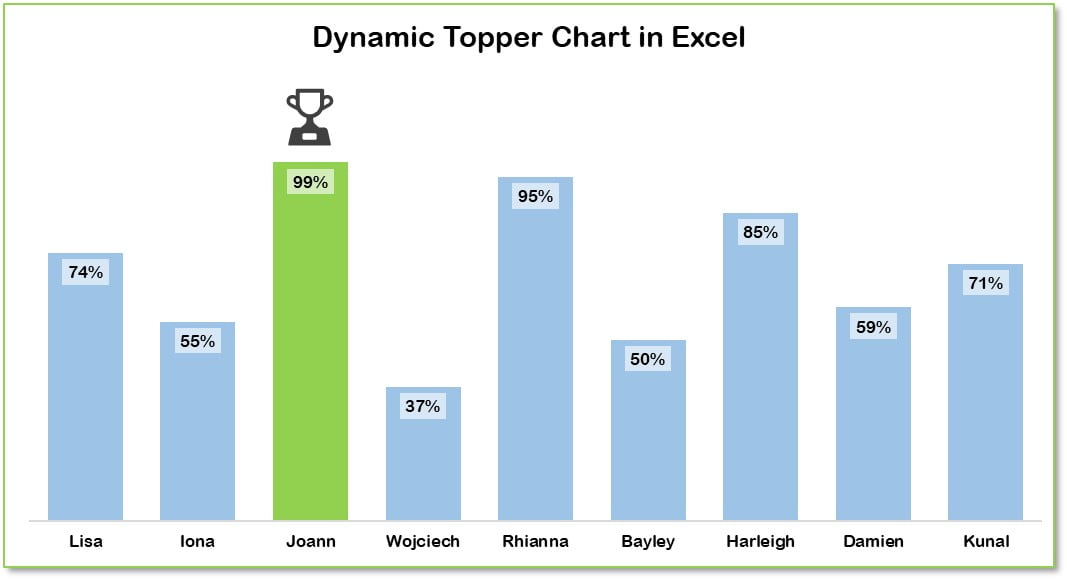
Our “Dynamically Highlight Topper Student Chart” is an innovative digital tool designed to visually spotlight top-performing students in real-time. Leveraging dynamic Excel functions, this chart automatically updates and highlights the highest achievers based on the latest data inputs
![Dynamically highlight topper student on the chart](https://www.pk-anexcelexpert.com/wp-content/uploads/2023/02/Dynamically-highlight-topper-student-on-the-chart-14.jpg)
Dynamically highlight topper student chart
23
Jun 2024
8Comments Off on Dynamically highlight topper student chart
PK
Meet PK, the founder of PK-AnExcelExpert.com! With over 15 years of experience in Data Visualization, Excel Automation, and dashboard creation. PK is a Microsoft Certified Professional who has a passion for all things in Excel. PK loves to explore new and innovative ways to use Excel and is always eager to share his knowledge with others. With an eye for detail and a commitment to excellence, PK has become a go-to expert in the world of Excel. Whether you're looking to create stunning visualizations or streamline your workflow with automation, PK has the skills and expertise to help you succeed. Join the many satisfied clients who have benefited from PK's services and see how he can take your Excel skills to the next level!
https://www.pk-anexcelexpert.com
Related Articles
Email Data Consolidation Tool in Excel
Now a days businesses rely more heavily on email communication. Managing data from multiple sources can become a real challenge.
Excel Tip : Fill the blanks cells in your data
Many times we have zig-zag data which has to be formatted in proper manner to create some report or dashboard.
Informative KPI Indicator Chart (Version-1)
I am back with one more stunning and Informative KPI Indicator Chart. In this chart I have used a RAG