In today’s competitive business environment, measuring employee productivity is crucial to ensuring organizational success. A Employee Productivity Tracking KPI Dashboard provides a comprehensive view of key performance indicators (KPIs) that help assess how efficiently employees are contributing to the company’s goals. By tracking these KPIs, managers can identify areas of improvement, boost performance, and enhance overall productivity.
Key Features of the Employee Productivity Tracking KPI Dashboard
The Employee Productivity Tracking KPI Dashboard comes with a set of features designed to give managers an in-depth view of their team’s performance. This includes multiple worksheets and a user-friendly interface that ensures ease of use and efficient data tracking.
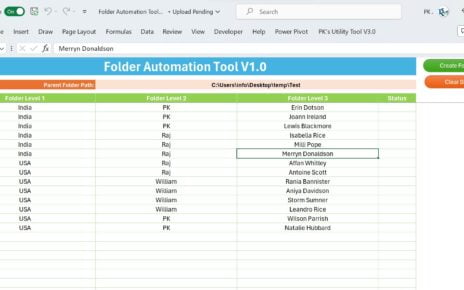
1. Home Sheet
The Home Sheet serves as an index sheet with buttons that allow users to navigate quickly to the other worksheets. It is the central point of access to all dashboard functionalities.
![]()
2. Dashboard Sheet Tab
The Dashboard Sheet is the main sheet where all KPIs are displayed. It provides the following insights:
- MTD (Month-to-Date) and YTD (Year-to-Date) data: It shows both the actual and target performance, as well as comparisons with the previous year’s data.
- Target vs. Actual and PY vs. Actual: Displays performance against the set targets and compares the current year’s data with the previous year’s data.
- Conditional Formatting: Upward or downward arrows are used to indicate whether performance is above or below the target, with corresponding color coding.
Users can select the month from a dropdown in Range D3, and all the dashboard data will automatically update based on that selection.
![]()
3. KPI Trend Sheet Tab
In the KPI Trend Sheet, users can select specific KPIs from Range C3. This sheet displays:
- KPI Group, Unit of KPI, and Type of KPI (whether “Lower the Better” or “Upper the Better”)
- The Formula for each KPI
- The Definition of each KPI
![]()
4. Actual Number Sheet Tab
In the Actual Number Sheet, users input the actual numbers for YTD and MTD for a specific month. Users can change the month by selecting the first month of the year in Range E1.
![]()
5. Target Sheet Tab
The Target Sheet allows users to input target numbers for each KPI for the MTD and YTD figures. This enables comparisons with actual performance data.
![]()
6. Previous Year Number Sheet Tab
In the Previous Year Number Sheet, users enter the previous year’s data for the KPIs. This historical data is important for comparing year-over-year performance.
![]()
7. KPI Definition Sheet Tab
The KPI Definition Sheet contains essential information about each KPI, including:
- KPI Name
- KPI Group
- Unit
- Formula
- KPI Definition
Read the detailed blog post