Tracking and managing ESG (Environmental, Social, and Governance) metrics is essential for businesses focused on sustainability and corporate responsibility. Our ESG KPI Dashboard in Excel is a ready-to-use, fully automated template that helps organizations efficiently monitor their MTD (Month-to-Date) and YTD (Year-to-Date) ESG performance. With dynamic visualizations, real-time trend analysis, and automated calculations, this dashboard simplifies ESG reporting and ensures compliance with sustainability standards.
Key Features of the ESG KPI Dashboard in Excel
7 Interactive Worksheets for Seamless Navigation
Home Sheet:
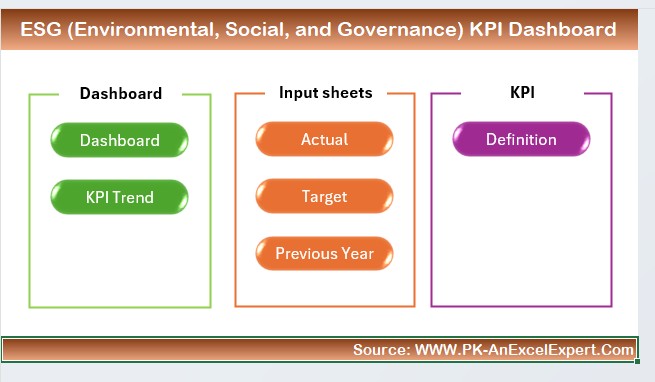
- Acts as an index with quick navigation buttons to different sections.
Dashboard Sheet:
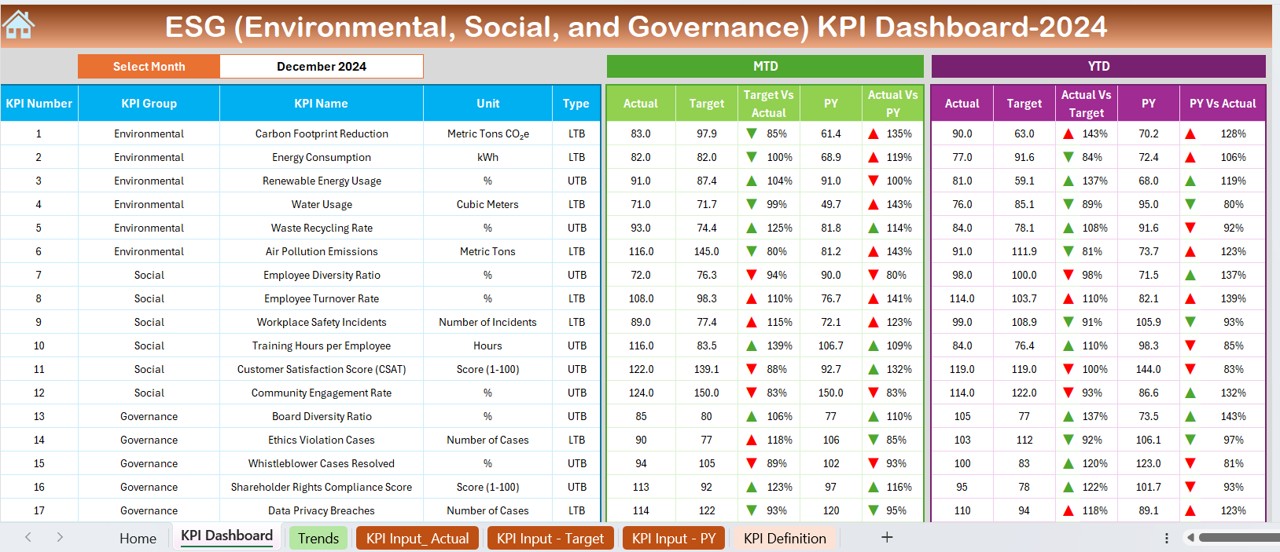
- Displays all ESG KPIs with real-time updates and month selection via a drop-down menu.
Comprehensive ESG KPI Tracking & Visualization
KPI Trend Sheet:
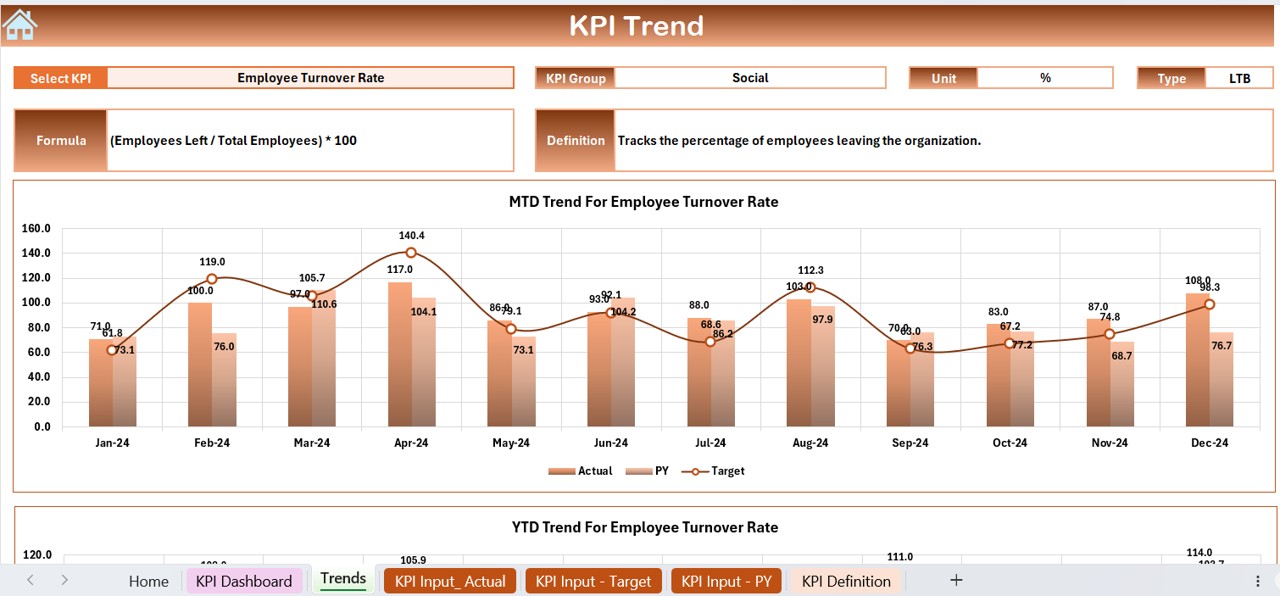
- Track MTD and YTD trends for key ESG indicators with interactive charts.
- Conditional Formatting: Uses up/down arrows for quick identification of performance trends.
Easy Data Input & Customization
- Actual Numbers Input Sheet: Enter monthly and yearly actual values with auto-calculations.
- Target & Previous Year Sheets: Input and compare current year vs. previous year ESG data.
- KPI Definition Sheet: Define KPIs, formulas, and performance units for consistent ESG tracking.
Automated Calculations & Real-Time Analysis
- Auto-adjusts dashboard numbers based on the selected month.
- Provides Target vs. Actual and Previous Year vs. Actual comparisons to enhance decision-making.