The Fashion KPI Dashboard in Power BI is a ready-to-use, powerful tool designed to streamline performance tracking in the fashion industry. By integrating data from Excel, this dashboard provides dynamic visualizations and actionable insights to help businesses monitor key performance indicators (KPIs) effectively. With its user-friendly interface and customizable features, it is ideal for fashion brands aiming to make data-driven decisions.
Key Features of the Fashion KPI Dashboard in Power BI
Summary Page:
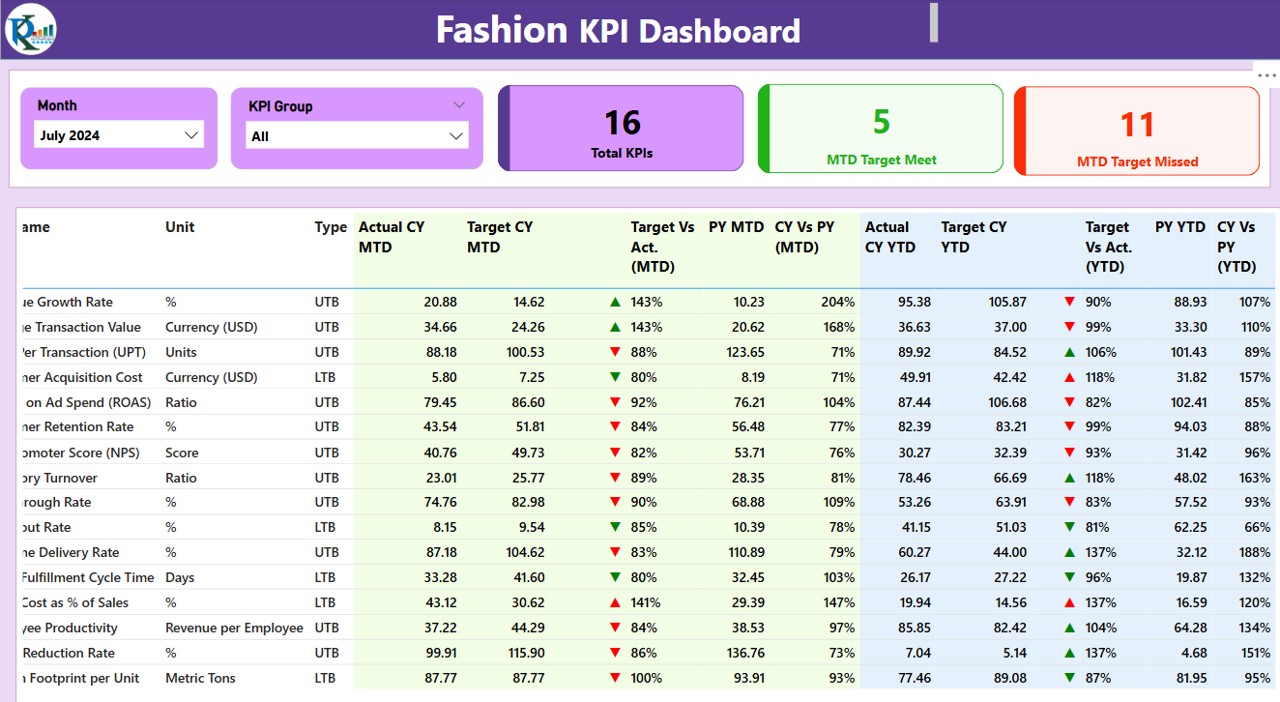
- View the Month and KPI Group slicers for targeted analysis.
- Performance cards display Total KPIs Count, MTD Target Meet Count, and MTD Target Missed Count.
- A detailed table provides insights into metrics like Actual vs. Target (MTD/YTD), KPI Group, Unit, and Year-over-Year comparisons, enhanced with performance icons (▲▼).
KPI Trend Page:
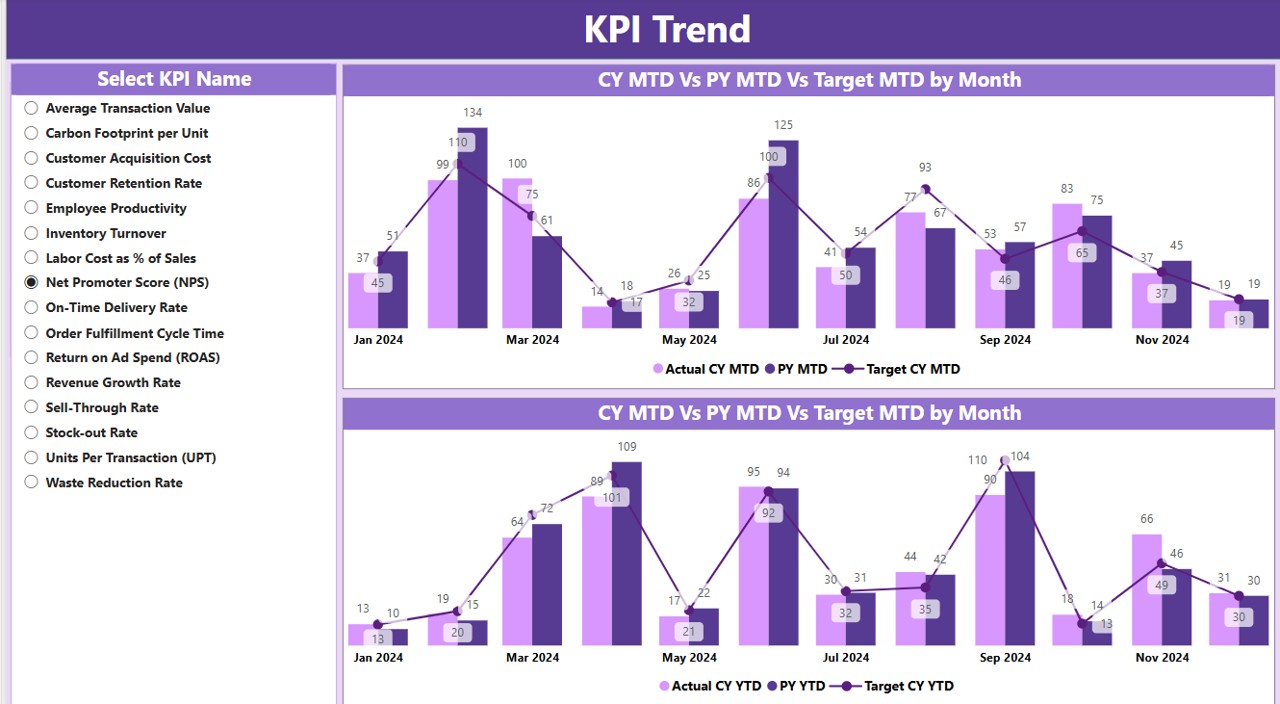
- Analyze performance trends using combo charts for MTD and YTD metrics.
- Use the slicer to focus on specific KPIs and compare Actual, Target, and Previous Year data.
KPI Definition Page:
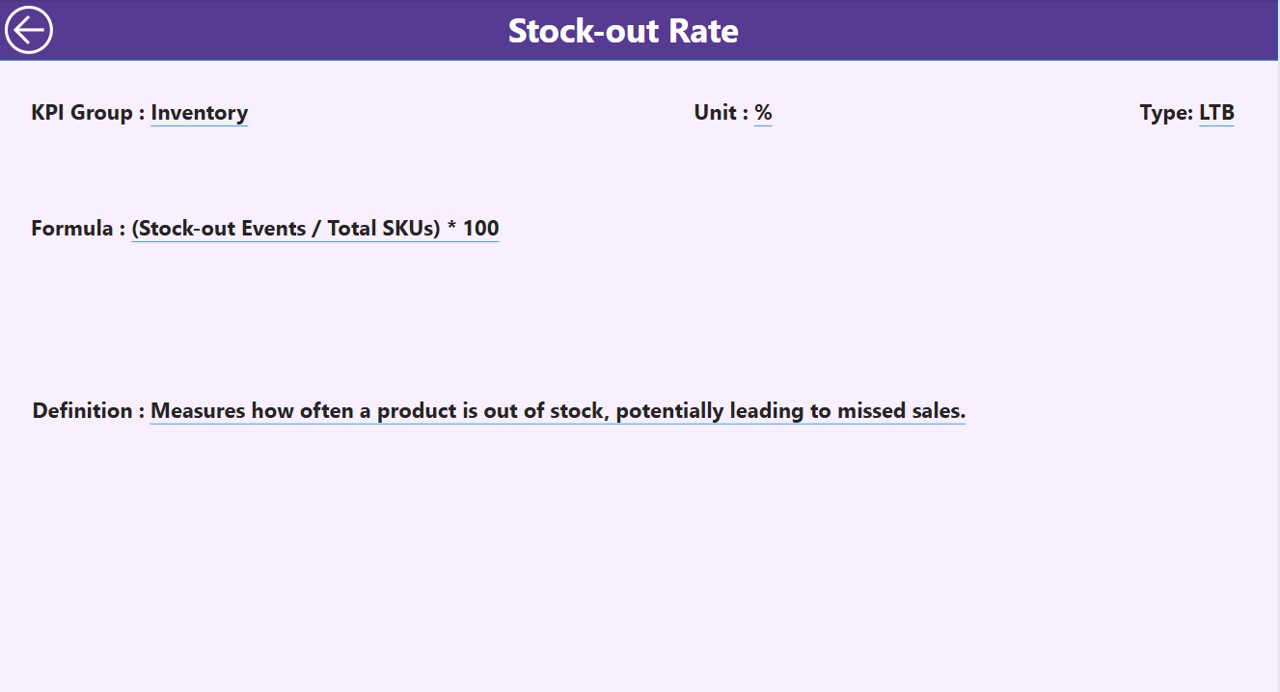
- Access detailed KPI descriptions, formulas, and definitions via a drill-through feature from the Summary Page.
- Seamlessly navigate back to the main page with a simple back button.
Excel Data Integration:
Input Actual Sheet:
- Record monthly and yearly actual performance metrics.
Input Target Sheet:
- Fill in target metrics for MTD and YTD.
KPI Definition Sheet:
- Define KPIs with relevant attributes like formulas, units, and measurement type (LTB/UTB).