- The Finance KPI Dashboard in Power BI is a fully interactive and ready-to-use solution designed to track and manage financial performance metrics effectively. Powered by data captured in Excel, this dashboard provides comprehensive insights with a user-friendly interface, enabling businesses to monitor KPIs with precision and clarity.
Key Features
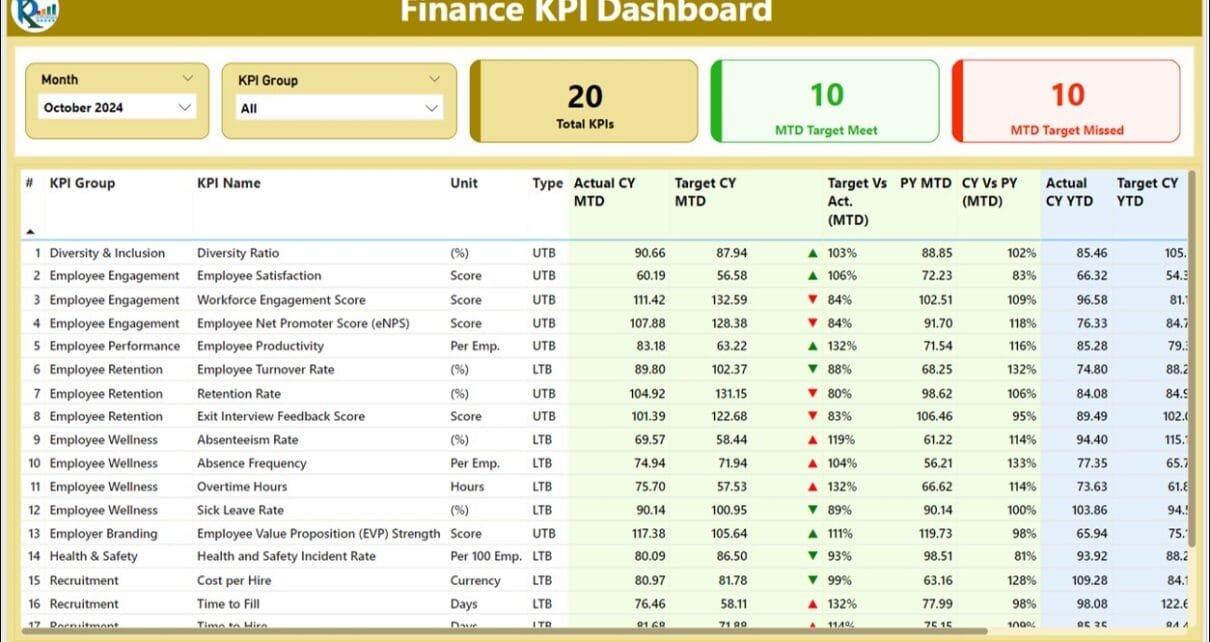
Summary Page
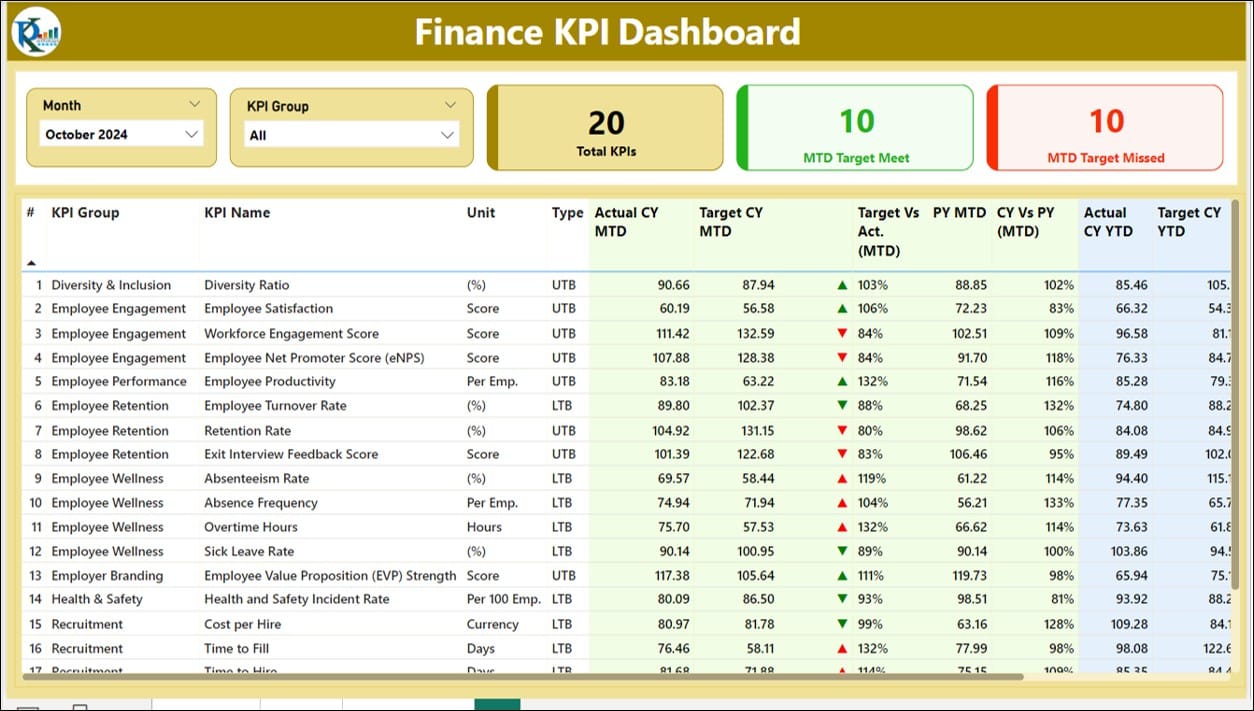
- Displays Month and KPI Group slicers for focused data analysis.
- Key cards highlight Total KPIs, MTD Target Met, and MTD Target Missed counts.
- Detailed table showcasing KPI metrics such as Actual vs. Target (MTD/YTD), trends, and comparisons with previous years.
KPI Trend Page
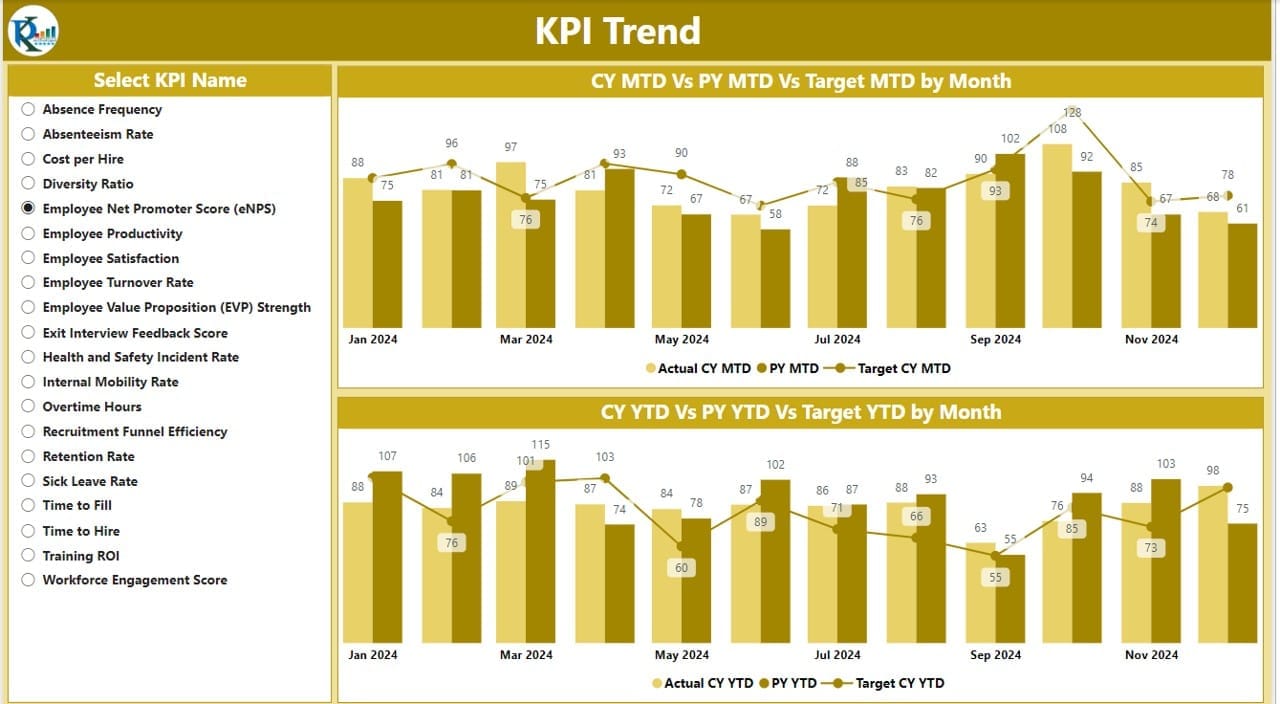
- Visual combo charts for MTD and YTD performance across Current Year, Previous Year, and Targets.
- Slicers for detailed KPI-specific insights.
KPI Definition Page
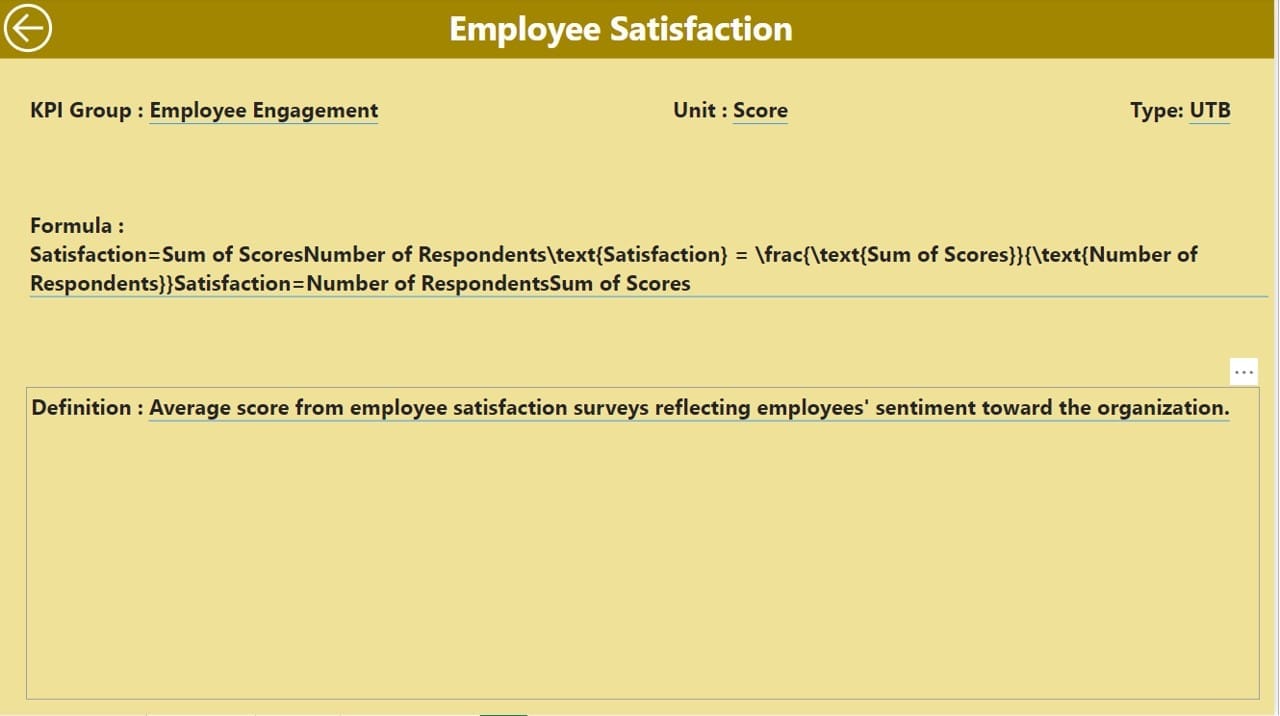
- Hidden drill-through page detailing KPI formulas and definitions.
- Easy navigation back to the main page with a dedicated back button.
Excel Data Integration
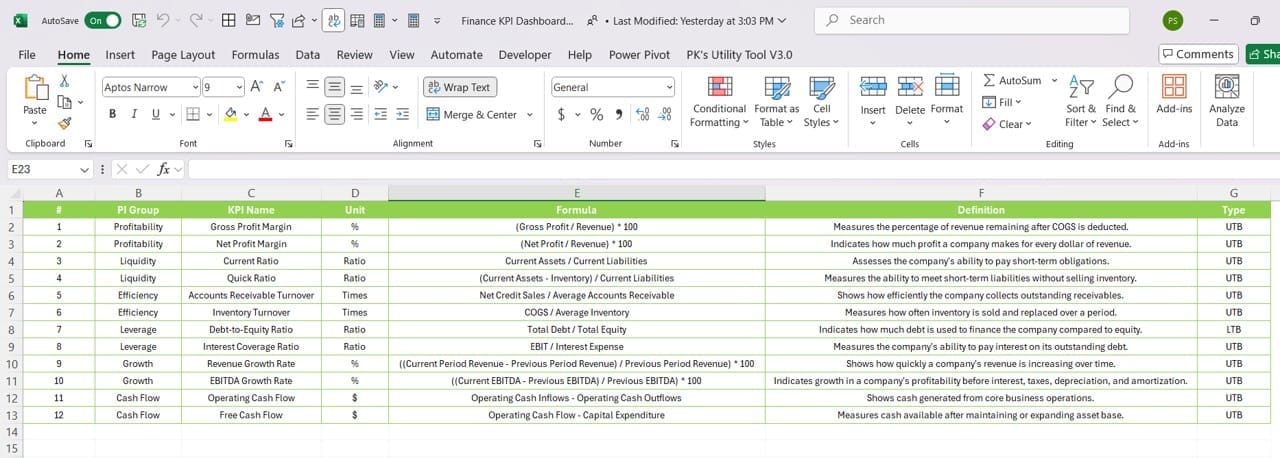
- Data source includes three pre-defined worksheets for Actuals, Targets, and KPI Definitions.
- Streamlined input fields for easy updates and accurate tracking.