Managing financial risk is essential for businesses to ensure stability and growth. Our Financial Risk KPI Dashboard in Excel is a ready-to-use template that helps track budget adherence and financial performance with dynamic KPIs. This dashboard provides clear insights into key financial metrics, empowering businesses to make data-driven decisions and mitigate risks effectively.
Key Features
Comprehensive KPI Tracking
Monitor MTD (Month-to-Date) and YTD (Year-to-Date) Actual vs. Target with interactive visual indicators.
Dynamic Dashboard
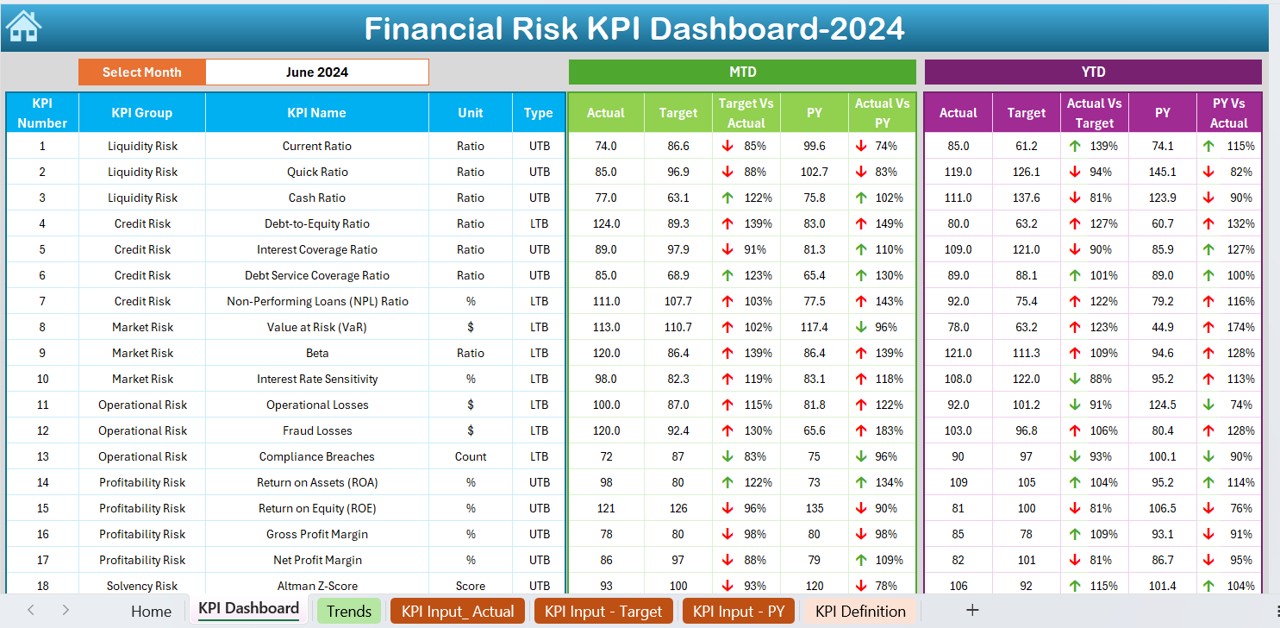
Select any month from the drop-down (D3) to update all financial data instantly.
Trend Analysis
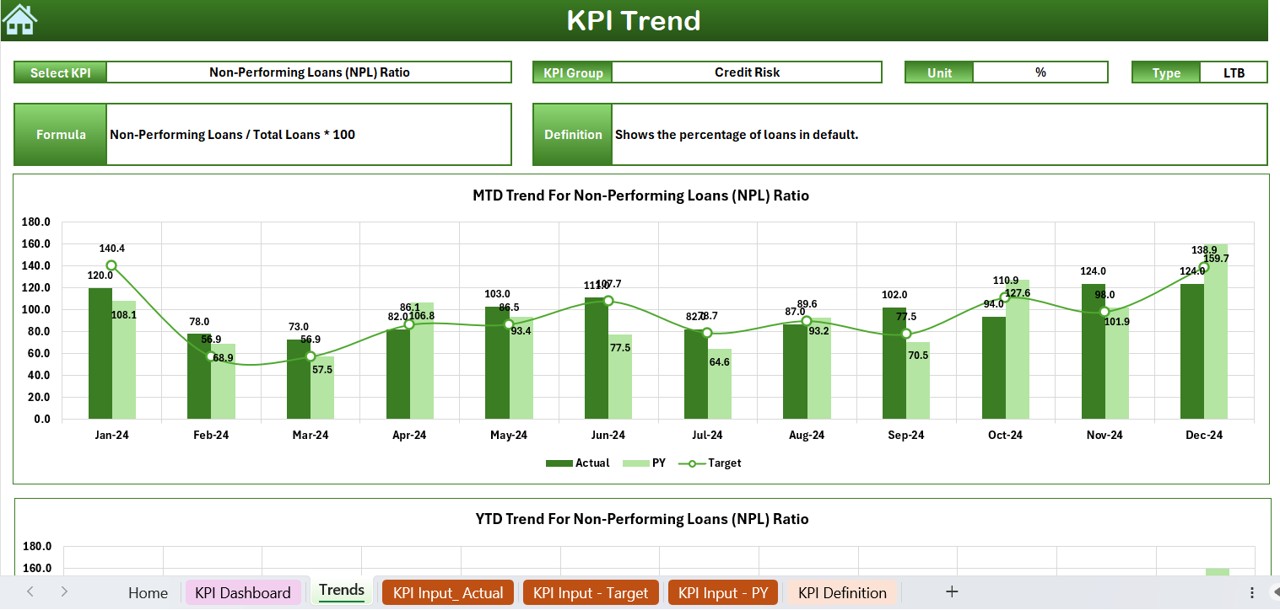
Track historical KPI performance with MTD & YTD trend charts for accurate forecasting.
User-Friendly Data Input
Input actual, target, and previous year’s financial figures with ease.
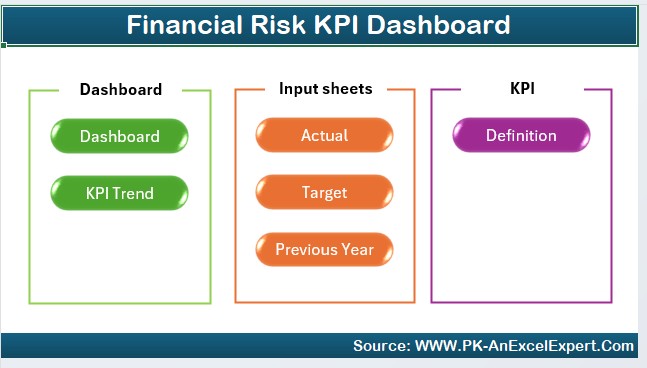
7 Structured Worksheets
Includes Home, Dashboard, KPI Trend, Actuals, Targets, Previous Year, and KPI Definition sheets for organized financial monitoring.
Conditional Formatting Indicators
Up/down arrows highlight performance trends for quick decision-making.
Customizable KPI Definitions
Modify KPI names, units, formulas, and groups as per business needs.