Home>Download>Fish Chart in Excel
Fish Chart in Excel

Fish Chart in Excel

The Fish Chart in Excel is a unique and innovative way to display sales data points. This dynamic chart not only visualizes data effectively but also adds an element of creativity by changing the fish graphics randomly upon each worksheet recalculation.
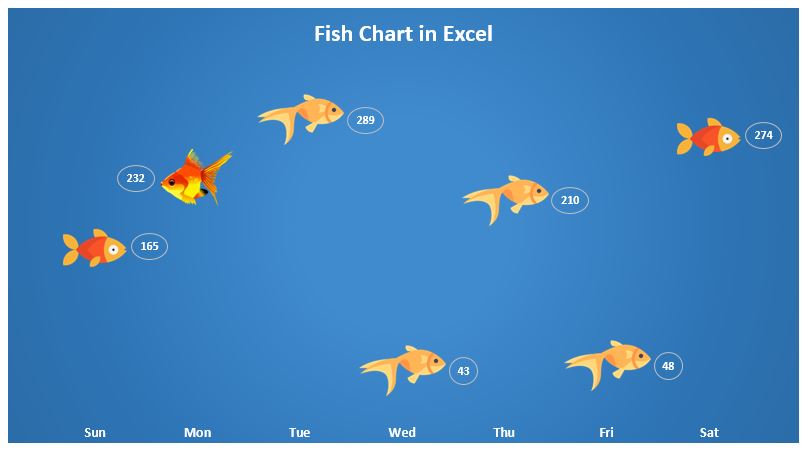
Fish Chart in Excel

Fish Chart in Excel

Key Features of Fish Chart in Excel

  • Dynamic Visualization: The Fish Chart changes the fish graphics randomly every time the worksheet is recalculated, adding an engaging and interactive element to your data presentation.
  • Creative Data Representation: The use of fish graphics with data labels appearing as water bubbles provides a visually appealing and distinctive way to display sales data points.
  • Simple Implementation: Built using a standard Line Chart in Excel, this creative chart can be easily integrated into your existing data analysis workflows.


PK
Meet PK, the founder of PK-AnExcelExpert.com! With over 15 years of experience in Data Visualization, Excel Automation, and dashboard creation. PK is a Microsoft Certified Professional who has a passion for all things in Excel. PK loves to explore new and innovative ways to use Excel and is always eager to share his knowledge with others. With an eye for detail and a commitment to excellence, PK has become a go-to expert in the world of Excel. Whether you're looking to create stunning visualizations or streamline your workflow with automation, PK has the skills and expertise to help you succeed. Join the many satisfied clients who have benefited from PK's services and see how he can take your Excel skills to the next level!
https://www.pk-anexcelexpert.com