Home>Download>Flag Chart in Excel
Flag Chart

Flag Chart in Excel

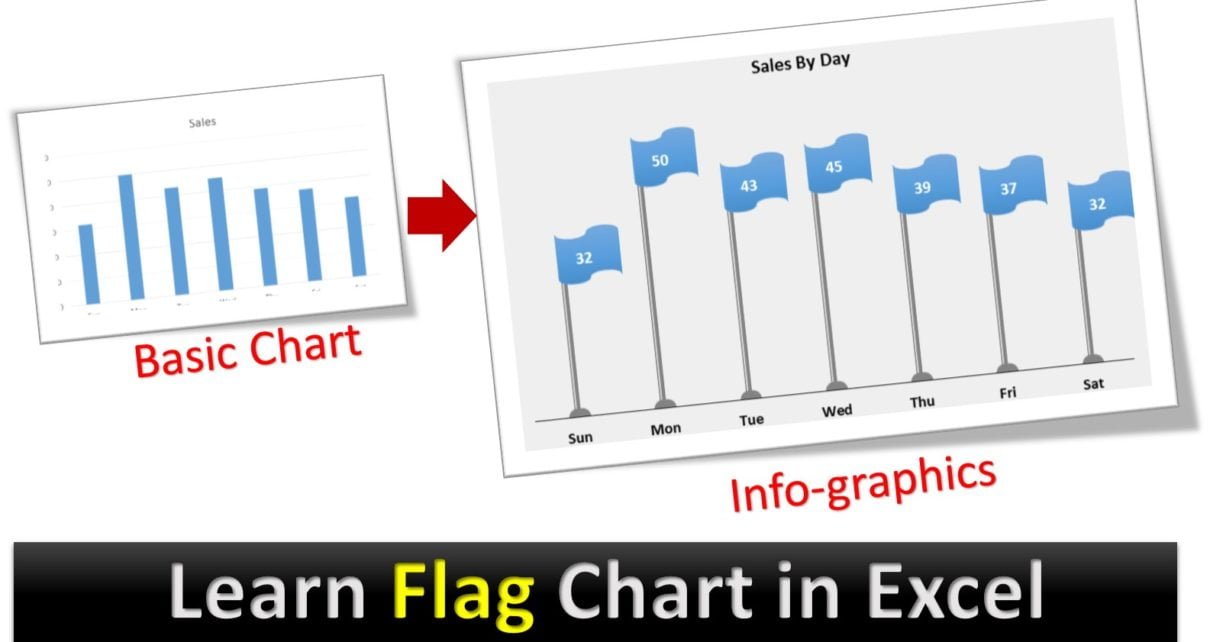
Transform your data into visually stunning graphics with our “Info-graphics: Flag Chart in Excel.” Ideal for small datasets, this creative charting approach combines simplicity with visual appeal, making it perfect for presentations and reports where you need to make an immediate impact. Discover how to make your data not just seen but remembered with our innovative flag chart design.

Flag Chart in Excel
Flag Chart in Excel

Key Features:

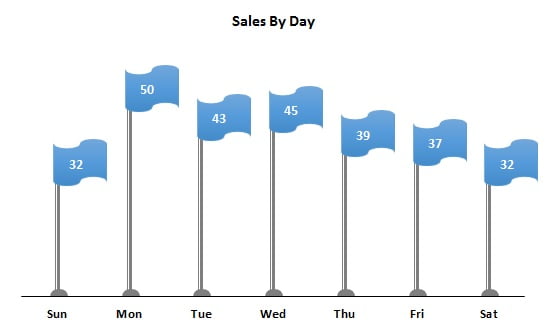
  • Visual Appeal: Utilizes 2D clustered column charts, error bars, and custom shapes to craft flag representations of data, ensuring your charts stand out.
  • Innovative Design: A fresh and eye-catching way to visualize data, perfect for capturing the attention of your audience during presentations.
  • Easy Customization: Designed for ease of use, allowing you to quickly adapt the chart to fit different datasets or aesthetic preferences.
PK
Meet PK, the founder of PK-AnExcelExpert.com! With over 15 years of experience in Data Visualization, Excel Automation, and dashboard creation. PK is a Microsoft Certified Professional who has a passion for all things in Excel. PK loves to explore new and innovative ways to use Excel and is always eager to share his knowledge with others. With an eye for detail and a commitment to excellence, PK has become a go-to expert in the world of Excel. Whether you're looking to create stunning visualizations or streamline your workflow with automation, PK has the skills and expertise to help you succeed. Join the many satisfied clients who have benefited from PK's services and see how he can take your Excel skills to the next level!
https://www.pk-anexcelexpert.com