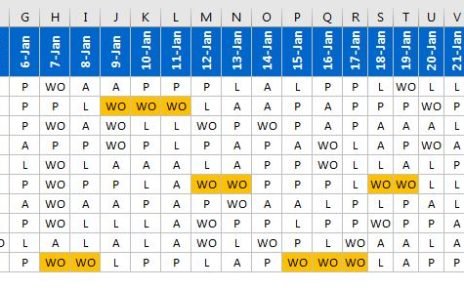
The Food Manufacturing KPI Dashboard in Excel is a powerful and user-friendly tool designed to help food manufacturers track, analyze, and optimize their operational performance. With this dashboard, you can easily monitor critical KPIs such as production efficiency, defect rates, cost management, and safety compliance. It simplifies complex data into visually appealing charts and tables, enabling stakeholders to make data-driven decisions with confidence.
Whether you’re looking to improve efficiency, enhance quality control, or reduce costs, this dashboard is the perfect solution for streamlining your food manufacturing operations.
Key Features of the Food Manufacturing KPI Dashboard in Excel
Home Sheet
- Acts as the central index for the dashboard.
- Includes six buttons for quick navigation across other worksheets.
- Offers a clean and intuitive user interface.

Dynamic Dashboard Sheet
- Displays MTD (Month-to-Date) and YTD (Year-to-Date) data for Actual, Target, and Previous Year metrics.
- Features dropdowns to filter data by month, dynamically updating the dashboard visuals.
- Incorporates conditional formatting with up and down arrows to highlight performance trends.

KPI Trend Analysis
- Allows users to select a KPI and view its details, including:
- KPI Group
- Measurement Unit
- Performance Type (e.g., Lower is Better or Upper is Better)
- Formula and Definition
- Helps track long-term trends for individual KPIs.

Data Entry Sheets
- Actual Number Sheet: Input monthly actual data for MTD and YTD metrics, dynamically updating based on the selected month.
- Target Sheet: Enter monthly and yearly target numbers for each KPI.
- Previous Year Sheet: Compare current performance with historical data by entering prior-year metrics.
KPI Definition Sheet
- Provides detailed definitions for all KPIs, including:
- KPI Name
- Group
- Unit of Measurement
- Formula for Calculation
- Explanation of the KPI’s significance
Visualization Tools
- Charts, graphs, and conditional formatting make it easy to identify trends and performance gaps.
- Fully customizable layout to meet unique business needs.
User-Friendly and Scalable
- Designed for ease of use, even for non-technical users.
- Scalable to include additional KPIs as your business grows.


