Unlock the full potential of your food service operations with our comprehensive Food Service KPI Dashboard in Power BI. Designed for seamless integration with Excel, this ready-to-use dashboard offers a robust platform for tracking, analyzing, and visualizing your key performance indicators with efficiency and ease Food Service KPI Dashboard.
Key Features of the Food Service KPI Dashboard
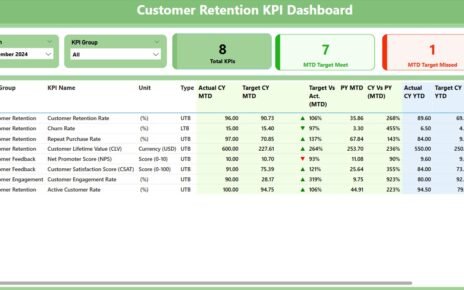
Summary Page:
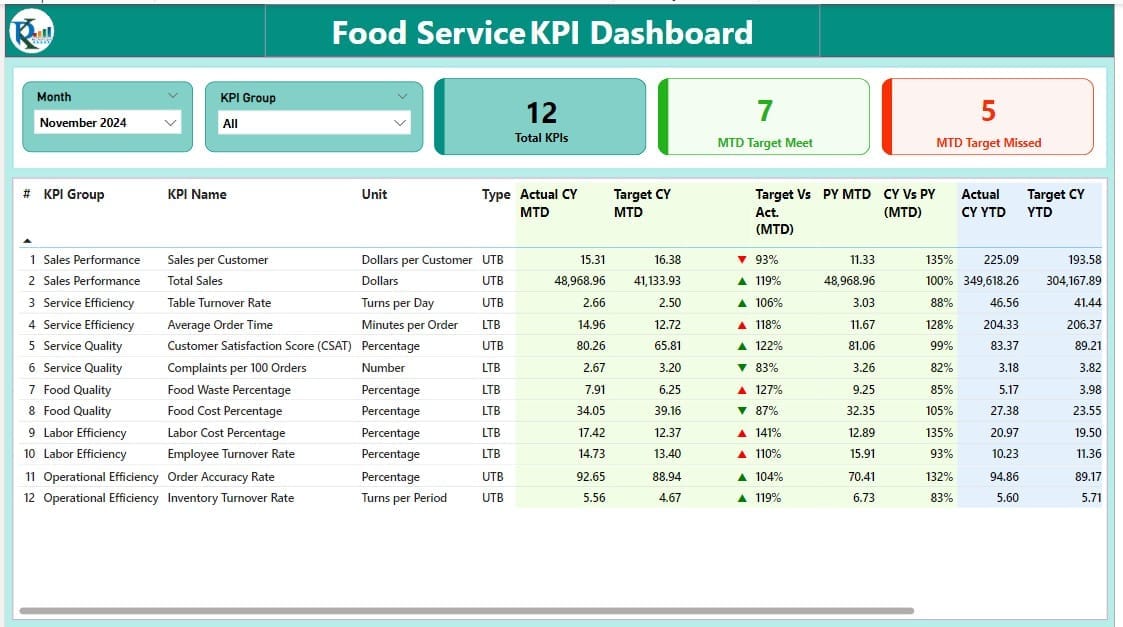
- Interactive Overview: Features dynamic slicers for Month and KPI Group, alongside three cards displaying Total KPIs count, MTD Target Meet count, and MTD Target Missed count.
- Detailed KPI Analysis: Presents a detailed table with metrics like KPI Number, KPI Group, KPI Name, Unit, Type (LTB or UTB), and performance icons (▼and ▲) indicating the status against MTD and YTD targets, supplemented by percentage comparisons of Target vs. Actual.
KPI Trend Page:
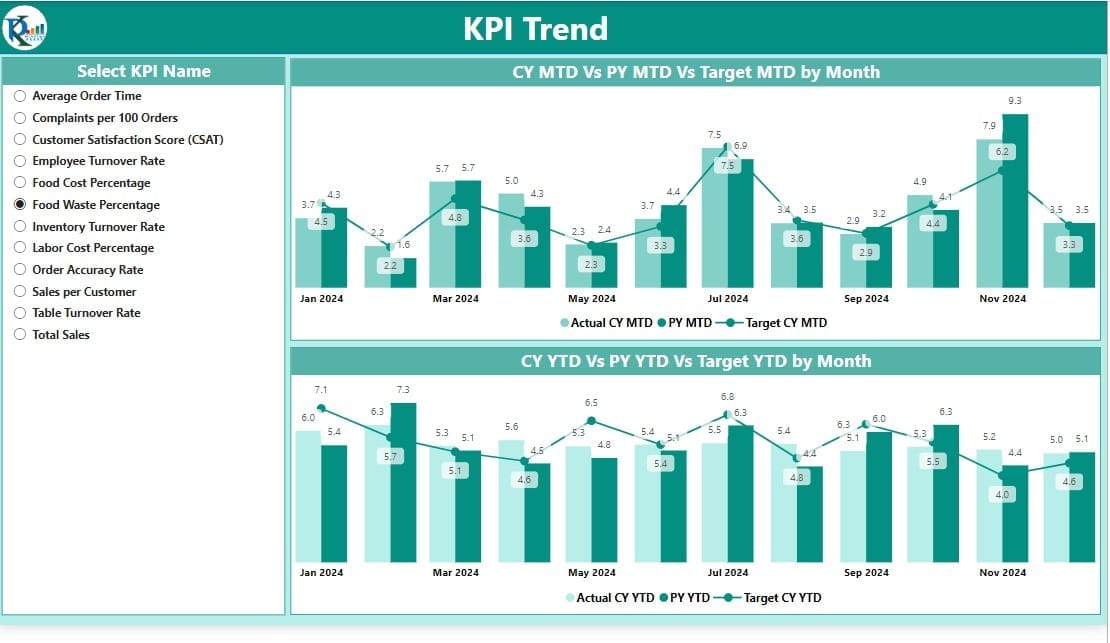
- Trend Visualization: Showcases two combo charts comparing Actual Numbers, Targets, and Previous Year figures for both MTD and YTD, with a slicer to select specific KPIs for focused analysis.
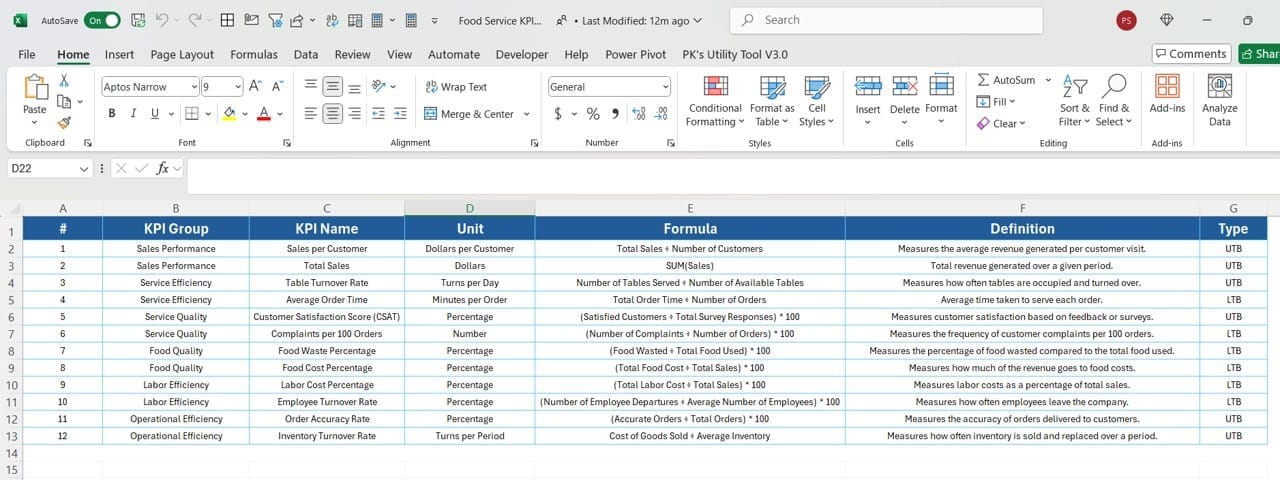
KPI Definition Page (Hidden Drill-Through):
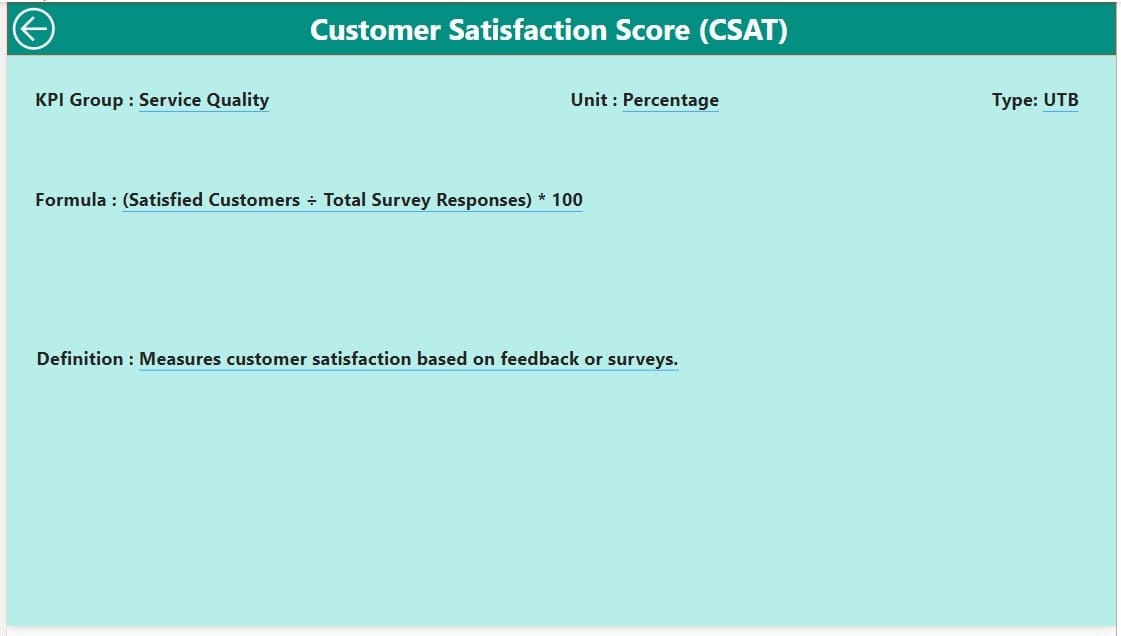
- Deep Dive Information: Provides a detailed view of each KPI’s formula and definition accessible via a drill-through feature from the Summary page. This hidden page ensures that detailed insights are just a click away.
Excel Data Integration:
- Utilize three designated Excel worksheets to input actual and target numbers for comprehensive monitoring and updates, ensuring your dashboard remains current and actionable.