The Freelance Business KPI Dashboard in Power BI is a ready-to-use interactive dashboard designed to help freelancers track and analyze their key performance indicators (KPIs) effectively. By leveraging Power BI and Excel, this dashboard provides insightful metrics, allowing freelancers to make data-driven decisions, improve business efficiency, and optimize performance.
Key Features:
Three Interactive Dashboard Pages
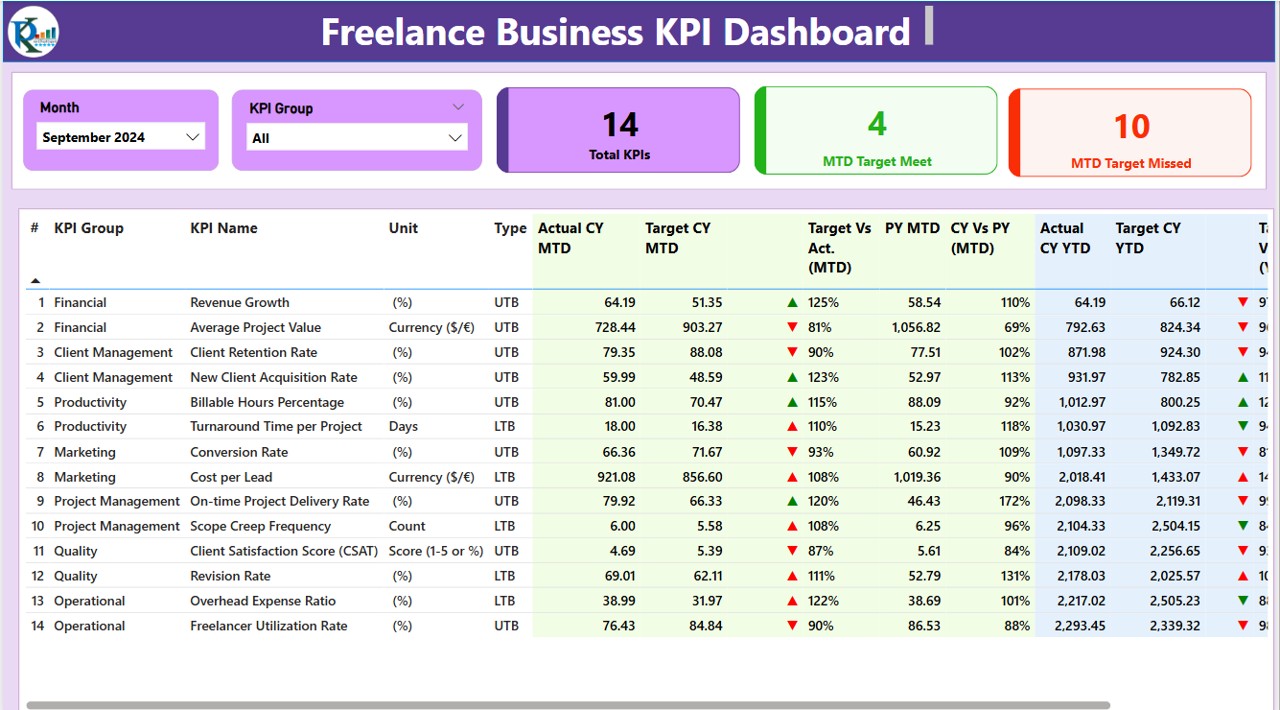
Summary, KPI Trend, and KPI Definition pages for comprehensive KPI tracking.
Real-Time KPI Monitoring
Track MTD (Month-to-Date) and YTD (Year-to-Date) performance with dynamic visual indicators.
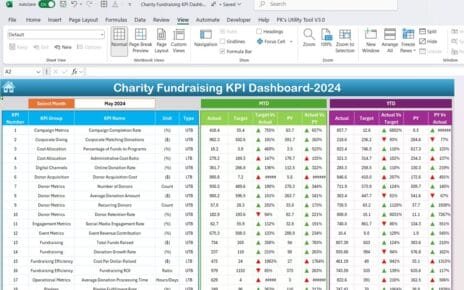
Customizable Data Inputs
Seamless integration with Excel files for easy KPI data entry.
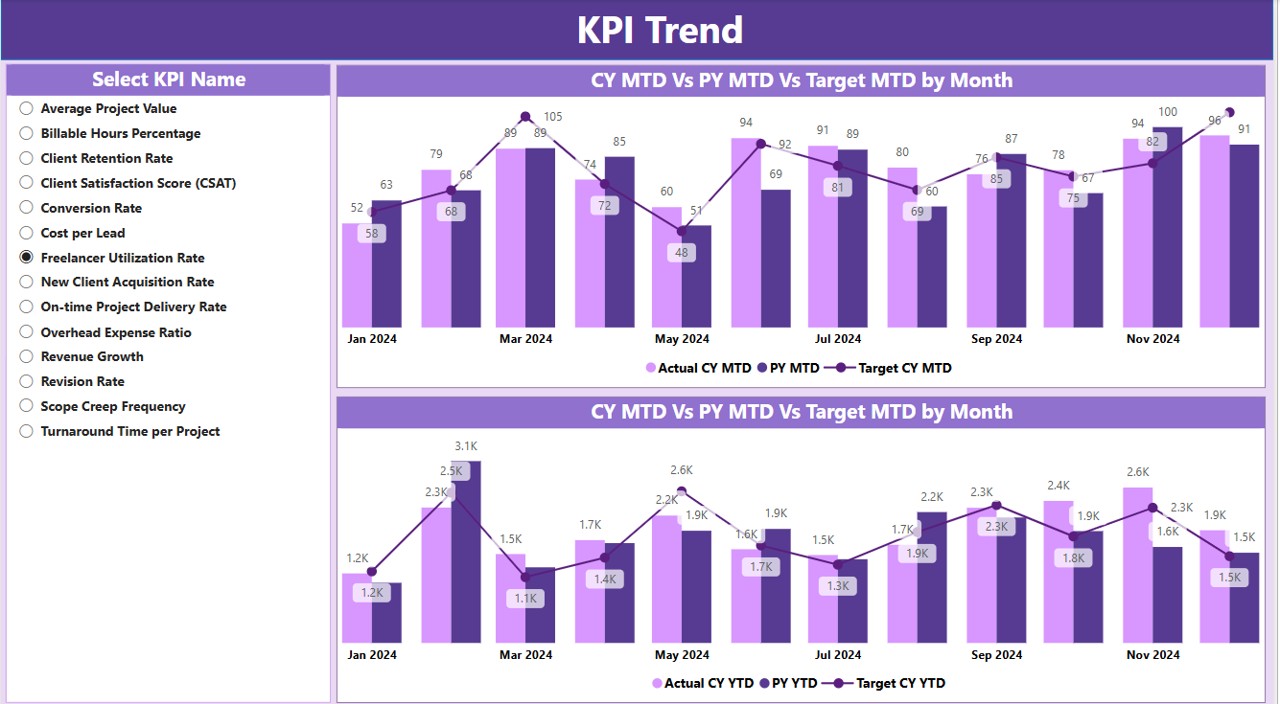
KPI Comparison Metrics
Analyze Current Year vs. Previous Year performance using intuitive charts and tables.
Drill-Through Analysis
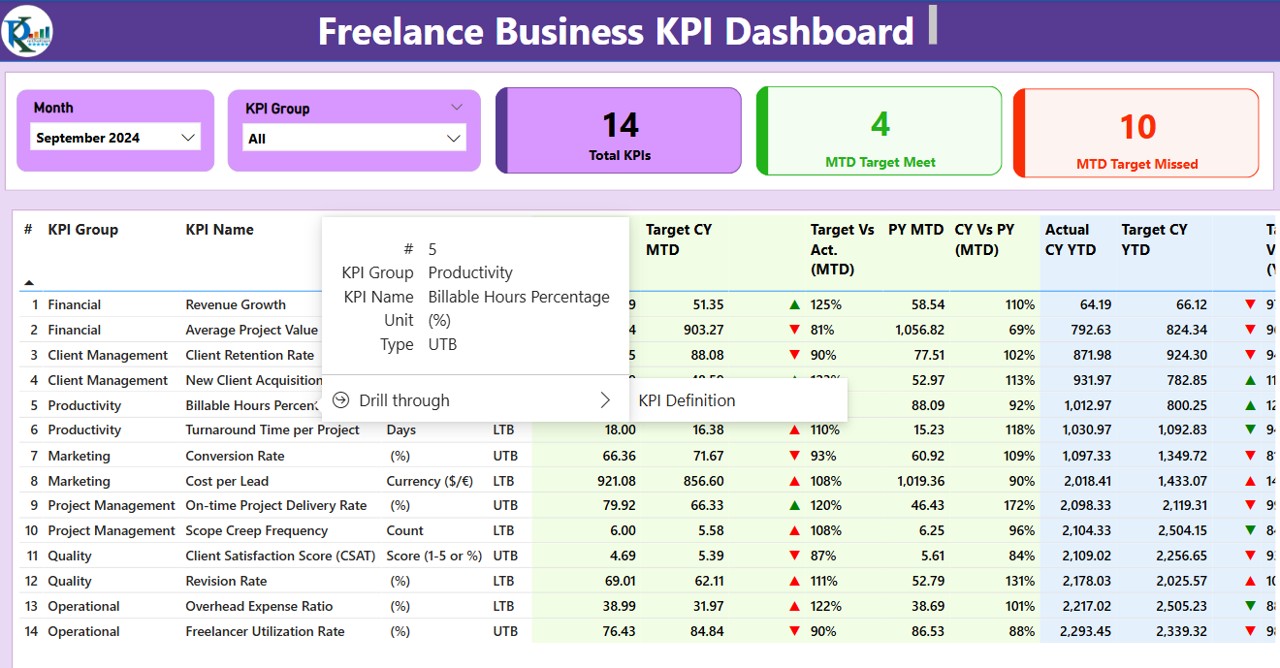
Access detailed KPI definitions and formulas with a single click.
User-Friendly Navigation
Includes slicers, icons, and a back button for a smooth experience.