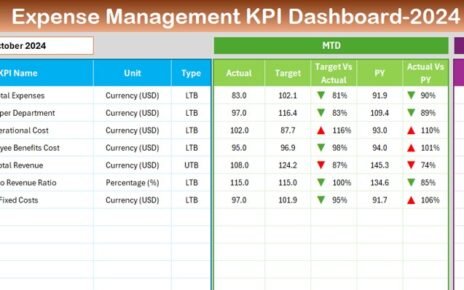
Navigate the complexities of freight cost management with precision using our comprehensive Freight Cost KPI Dashboard in Excel. Designed to deliver immediate insights into your shipping expenses, this dashboard helps you monitor and control costs with ease, enhancing your financial strategy and operational efficiencies.
Key Features of the Freight Cost KPI Dashboard
Multi-Sheet Functionality:

The dashboard consists of 7 specialized worksheets including a Home sheet with quick navigation buttons, detailed KPI visualization on the Dashboard tab, and dedicated tabs for KPI trends, actual inputs, targets, previous year comparisons, and KPI definitions.
Dynamic Data Interaction:

Select different months and KPIs from drop-down menus to see updated data throughout the dashboard, ensuring you can track performance over different periods and under various conditions.
Advanced Visualization and Analysis:

Features like MTD and YTD data comparisons, Target vs. Actual, and Previous Year vs. Actual are displayed with conditional formatting, providing clear visual cues (up and down arrows) to instantly indicate performance trends.
Comprehensive Customization:
Input your specific KPIs, with fields for their names, groups, units, formulas, and definitions, making this tool not just a dashboard but a pivotal part of your strategic toolkit.


