Home>Download>Freight Management KPI Dashboard in Power BI

Freight Management KPI Dashboard in Power BI

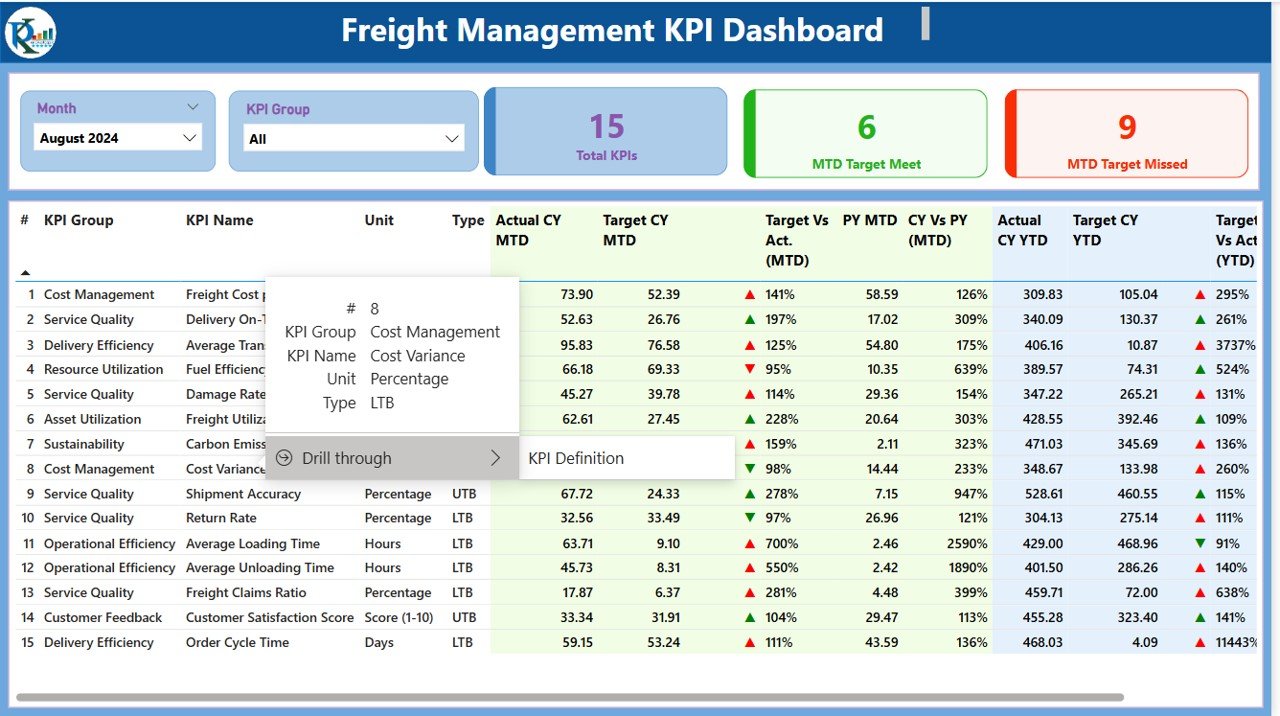
The Freight Management KPI Dashboard in Power BI is a dynamic tool designed to help businesses optimize their freight operations through real-time monitoring and insightful data analysis. By tracking key performance indicators (KPIs), companies can make data-driven decisions that improve efficiency, reduce costs, and ensure timely deliveries.

Key Features of the Freight Management KPI Dashboard:

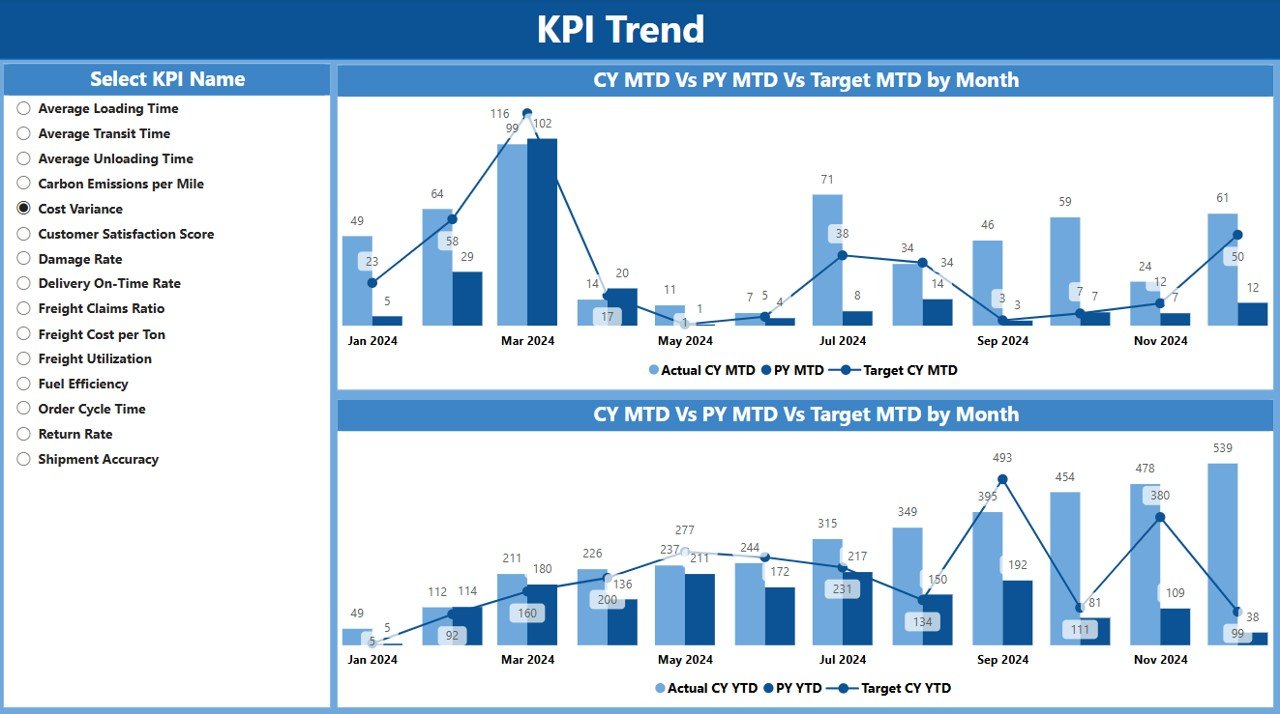
  • Real-Time Performance Tracking: Stay updated with live KPI data, allowing quick decision-making.

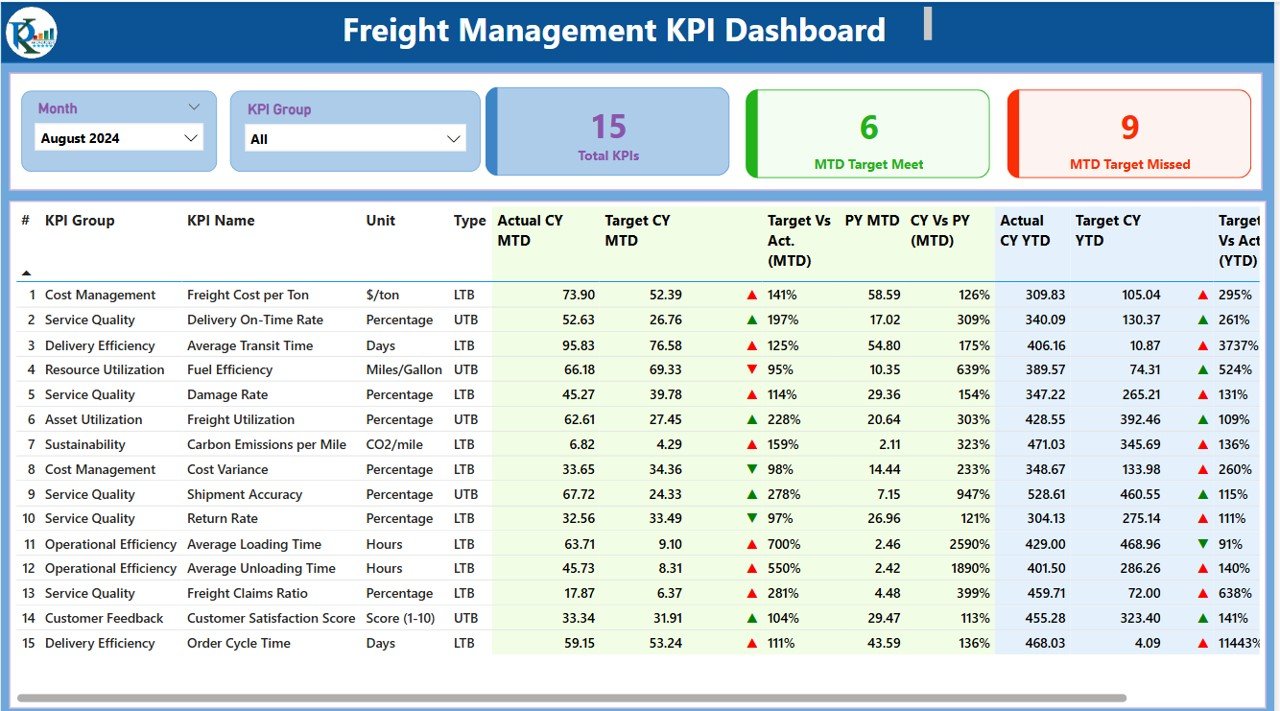
  • Comprehensive Data Visualization: Leverage Power BI’s advanced visualizations for easier analysis of performance metrics.

  • Excel Integration: Seamlessly import and update data from Excel, ensuring real-time reporting for freight operations.

Read the detailed blog post

PK
Meet PK, the founder of PK-AnExcelExpert.com! With over 15 years of experience in Data Visualization, Excel Automation, and dashboard creation. PK is a Microsoft Certified Professional who has a passion for all things in Excel. PK loves to explore new and innovative ways to use Excel and is always eager to share his knowledge with others. With an eye for detail and a commitment to excellence, PK has become a go-to expert in the world of Excel. Whether you're looking to create stunning visualizations or streamline your workflow with automation, PK has the skills and expertise to help you succeed. Join the many satisfied clients who have benefited from PK's services and see how he can take your Excel skills to the next level!
https://www.pk-anexcelexpert.com