The Google Analytics KPI Dashboard in Excel is a ready-to-use template designed to help businesses track, analyze, and visualize key website performance metrics efficiently. This comprehensive dashboard consolidates essential KPIs, making it easier to monitor traffic trends, conversions, and engagement in one place. With its user-friendly interface and dynamic data updates, it is an ideal solution for marketers, analysts, and business owners looking to make data-driven decisions.
Key Features of the Google Analytics KPI Dashboard
Home Sheet
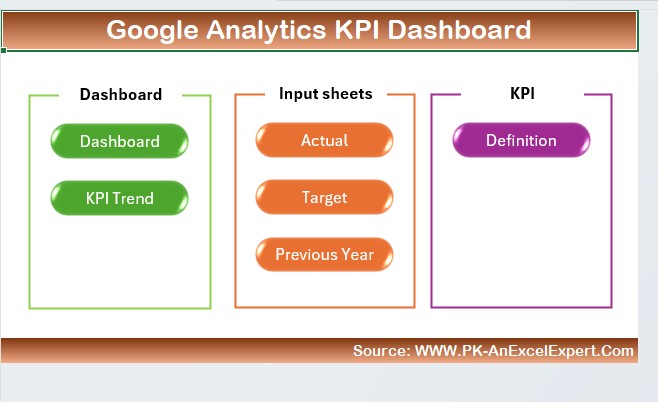
- Acts as an index page with six quick-access buttons.
- Provides easy navigation to all dashboard sections.
Dashboard Sheet

- Displays MTD (Month-to-Date) and YTD (Year-to-Date) actuals, targets, and previous year comparisons.
- Includes dynamic drop-down selection to switch between months.
- Uses conditional formatting with up/down arrows for visual insights.
KPI Trend Sheet
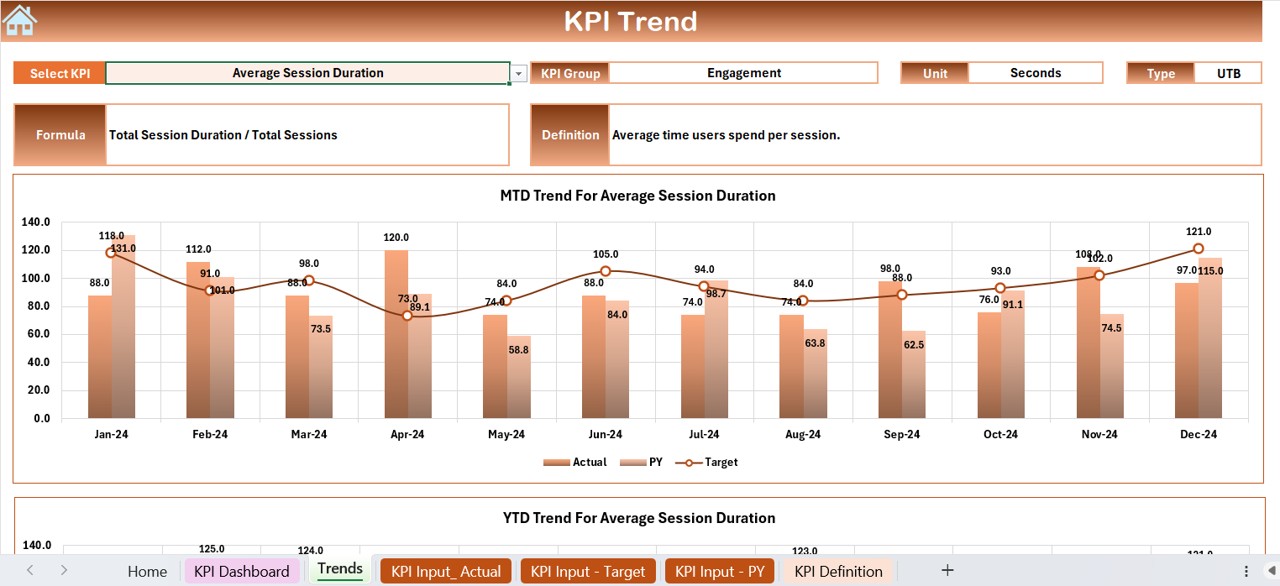
- Allows selection of specific KPIs from a drop-down list.
- Displays KPI definitions, formulas, and performance trends.
- Includes MTD and YTD trend charts for actual, target, and previous year data.
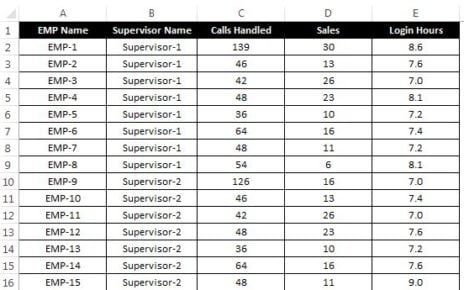
Actual Numbers Input Sheet
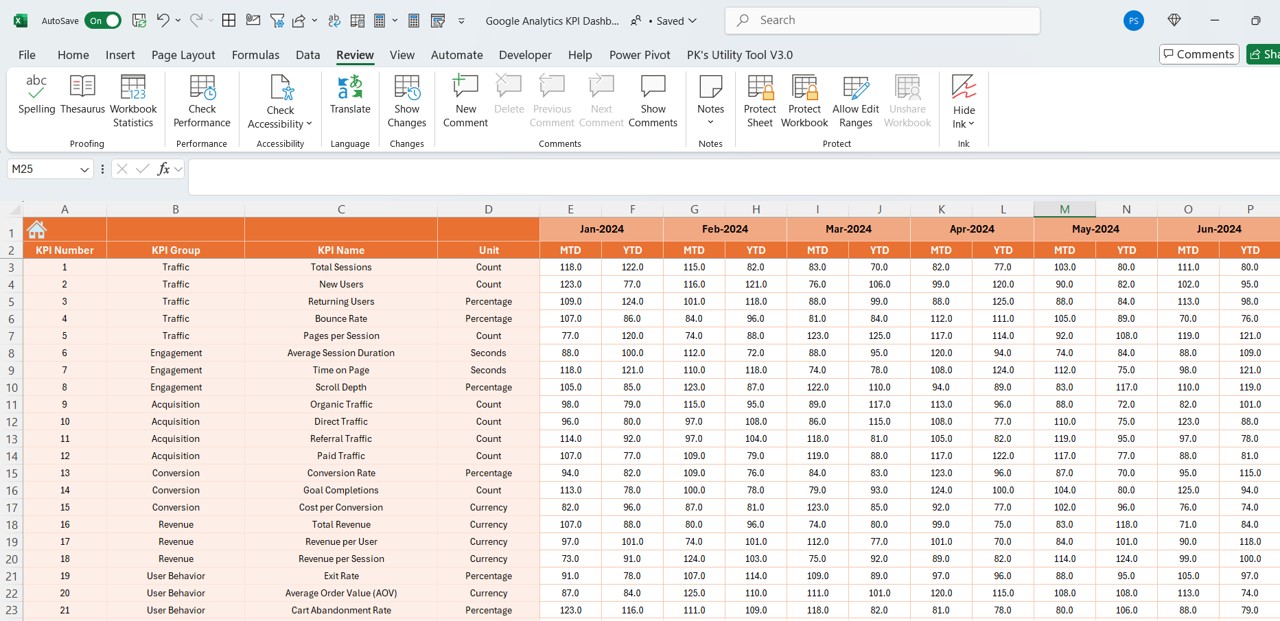
- Enables users to input actual performance data for different months.
- Offers an option to set the first month dynamically for accurate reporting.
Target Sheet
- Users can input target values for each KPI on a monthly and yearly basis.
Previous Year Numbers Sheet
- Stores last year’s performance data for accurate comparisons and trend analysis.
KPI Definition Sheet
- Includes detailed KPI descriptions, such as:
- KPI Name, KPI Group, Unit of Measurement, Formula, and Definition.