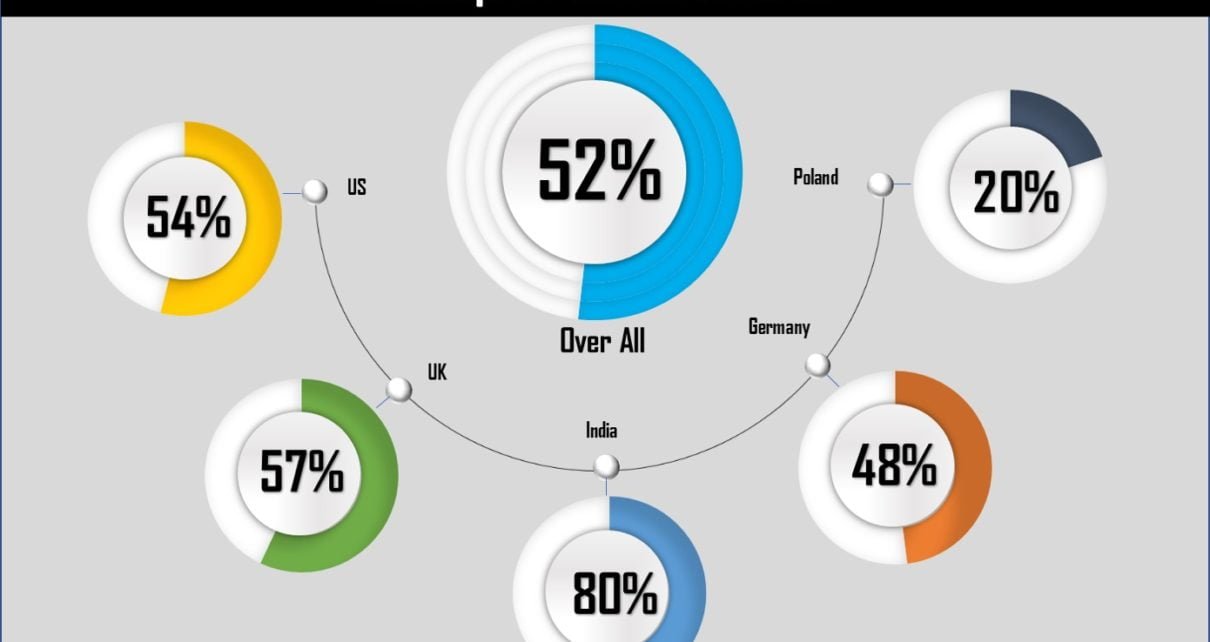
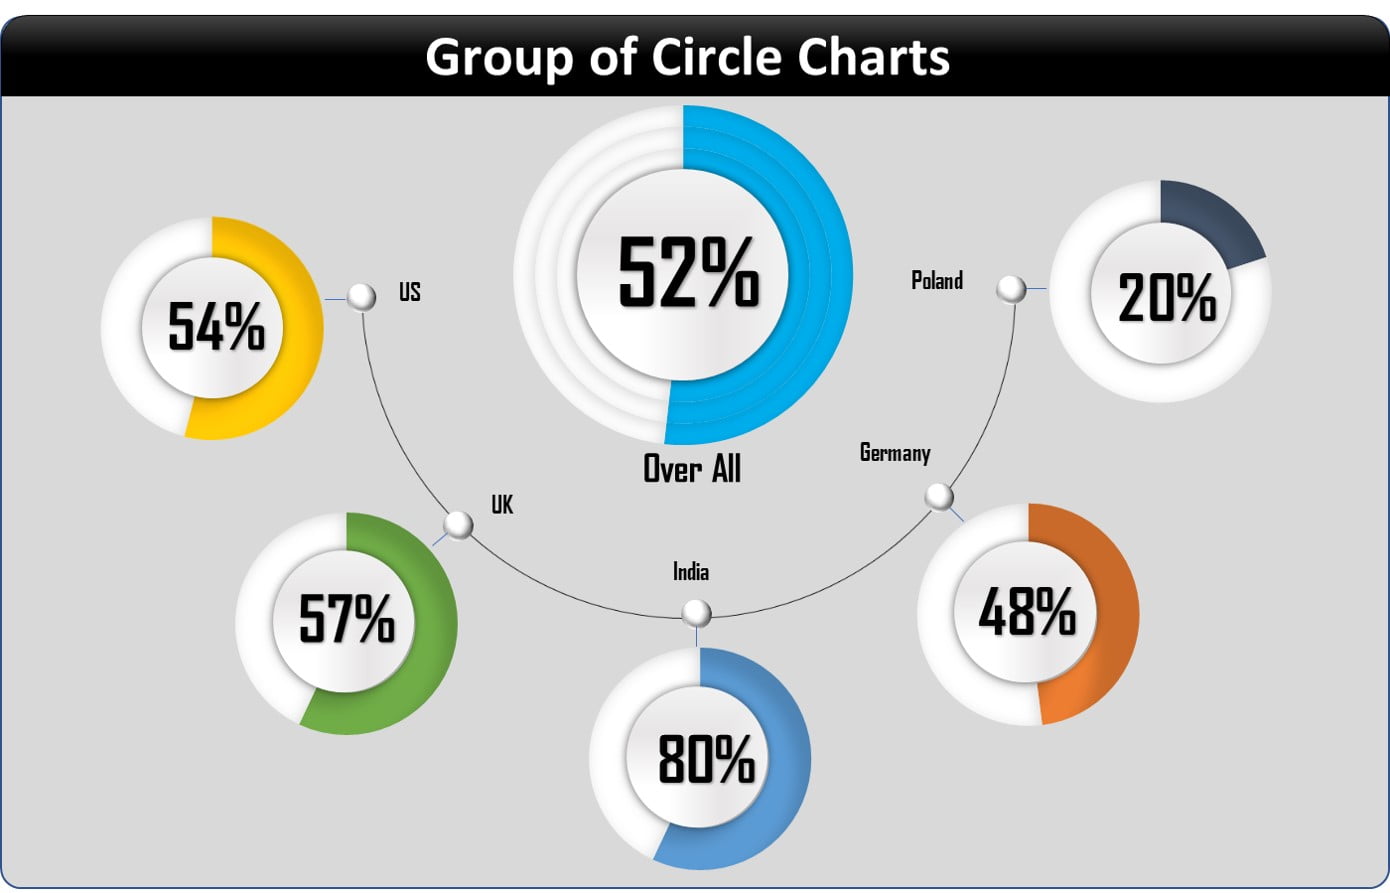
This ready-to-use product allows you to quickly and effectively visualize data through a series of circle charts, ideal for comparing proportions, visualizing compositions, and presenting complex information in an intuitive and aesthetically pleasing format.
Group of Circle Charts in Excel
28
May 2024
79Comments Off on Group of Circle Charts in Excel
PK
Meet PK, the founder of PK-AnExcelExpert.com! With over 15 years of experience in Data Visualization, Excel Automation, and dashboard creation. PK is a Microsoft Certified Professional who has a passion for all things in Excel. PK loves to explore new and innovative ways to use Excel and is always eager to share his knowledge with others. With an eye for detail and a commitment to excellence, PK has become a go-to expert in the world of Excel. Whether you're looking to create stunning visualizations or streamline your workflow with automation, PK has the skills and expertise to help you succeed. Join the many satisfied clients who have benefited from PK's services and see how he can take your Excel skills to the next level!
https://www.pk-anexcelexpert.com
Related Articles
What-If Analysis (Goal Seek, Scenario Manager and Data Table)
In this article, we you will learn about What-If Analysis in Microsoft Excel. You can use several different sets of
Dynamic chart for Top Selected Employees with GROUPBY and TAKE function
In today's fast-paced business environment, visual data representation has become an indispensable tool for decision-making and performance analysis. One effective
Power BI dashboard with 3D Glass Chart
Data visualization is an important part of modern businesses. It helps companies to make decisions based on data-driven insights. Microsoft