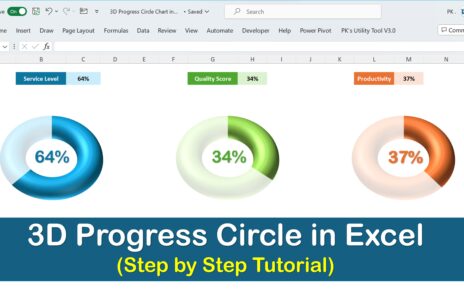
Transform your data visualization with our Animated Hour Glass Chart in Excel, a dynamic and engaging way to represent key performance indicators (KPIs) like Service Level, Quality Score, and Productivity. Designed to bring your metrics to life, this innovative chart updates animations in real time as data changes, making it a compelling tool for presentations and reports Info-graphics: Animated Hour Glass Chart in Excel.

Key Features:
- Real-Time Animation: Experience seamless animations that respond dynamically to changes in KPI metrics, visually simulating the flow of an hourglass.
- Customizable Metrics Display: Tailor the chart to showcase various KPIs relevant to your business needs, ensuring that critical data points are highlighted effectively.
- Interactive Data Updates: Utilize the embedded VBA code to trigger animations automatically whenever values in designated cells change, enhancing the interactivity of your data presentation.


