Dive into the transformative world of infographics with our “Infographics with Info-graphics with Column chart
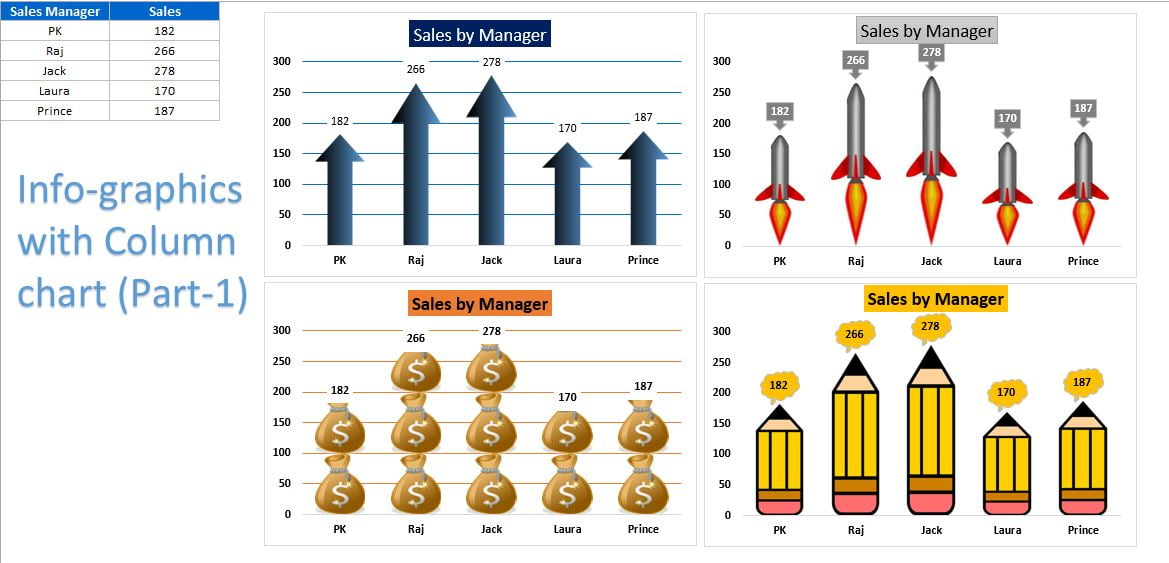
” Excel tutorial. This paid file is designed to enhance the visual impact and audience engagement of your reports and dashboards by integrating creative infographic elements into your column charts, specifically tailored for displaying sales by manager.
Key Features:
- Engaging Visuals: Incorporate unique infographic elements such as Arrows, Rockets, Revenue Icons, and Pencils to depict sales data vividly, making complex information more accessible and engaging.
- Versatile Use Cases: Tailored for use in business dashboards, detailed reports, and dynamic presentations, these charts are versatile tools for professionals looking to elevate their data presentation skills.
- Customizable Options: Each chart is fully customizable, allowing you to adapt the visual style to fit different datasets or presentation contexts, enhancing both the utility and the aesthetic appeal of your Excel documents.
Read the detailed blog post