Home>Download>Informative KPI Indicator Chart Version-2)
Informative KPI Indicator V2

Informative KPI Indicator Chart Version-2)

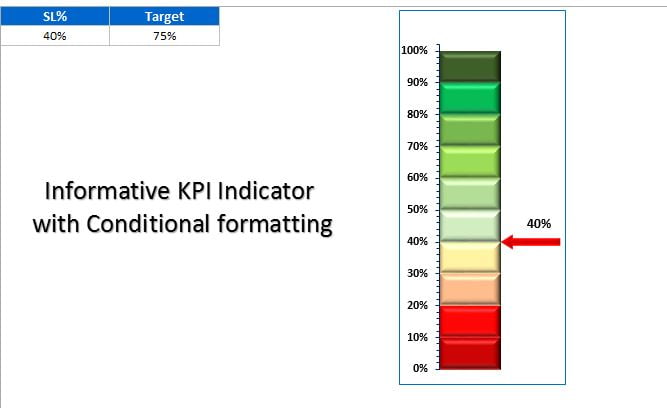
Enhance your data analysis and reporting capabilities with the “Informative KPI Indicator Chart Version-2,” a powerful Excel tool designed to provide clear and actionable insights into key performance indicators. This updated version incorporates a RAG (Red, Amber, Green) color palette across ten slices, enabling precise performance tracking.


Informative KPI Indicator Chart Version-2)

Key Features:

  • RAG Color Palette: Each slice represents 10% of your KPI, visually segmenting performance in a straightforward, easy-to-understand manner.
  • Dynamic Indicator Movement: The indicator adjusts automatically as the Service Level percentage changes, providing real-time visual feedback on performance relative to targets.
  • Color-Coded Feedback: The indicator arrow changes color—red for below target and green for at or above target—offering an immediate visual cue about performance status.
PK
Meet PK, the founder of PK-AnExcelExpert.com! With over 15 years of experience in Data Visualization, Excel Automation, and dashboard creation. PK is a Microsoft Certified Professional who has a passion for all things in Excel. PK loves to explore new and innovative ways to use Excel and is always eager to share his knowledge with others. With an eye for detail and a commitment to excellence, PK has become a go-to expert in the world of Excel. Whether you're looking to create stunning visualizations or streamline your workflow with automation, PK has the skills and expertise to help you succeed. Join the many satisfied clients who have benefited from PK's services and see how he can take your Excel skills to the next level!
https://www.pk-anexcelexpert.com