Harness the full potential of your data with the Infrastructure KPI Dashboard in Power BI, a comprehensive solution designed to optimize the monitoring and management of your key performance indicators. This dashboard is your gateway to a deeper understanding of infrastructure performance, leveraging data captured in an intuitive Excel format.
Key Features of the Infrastructure KPI Dashboard
Summary Page: Central Performance Overview
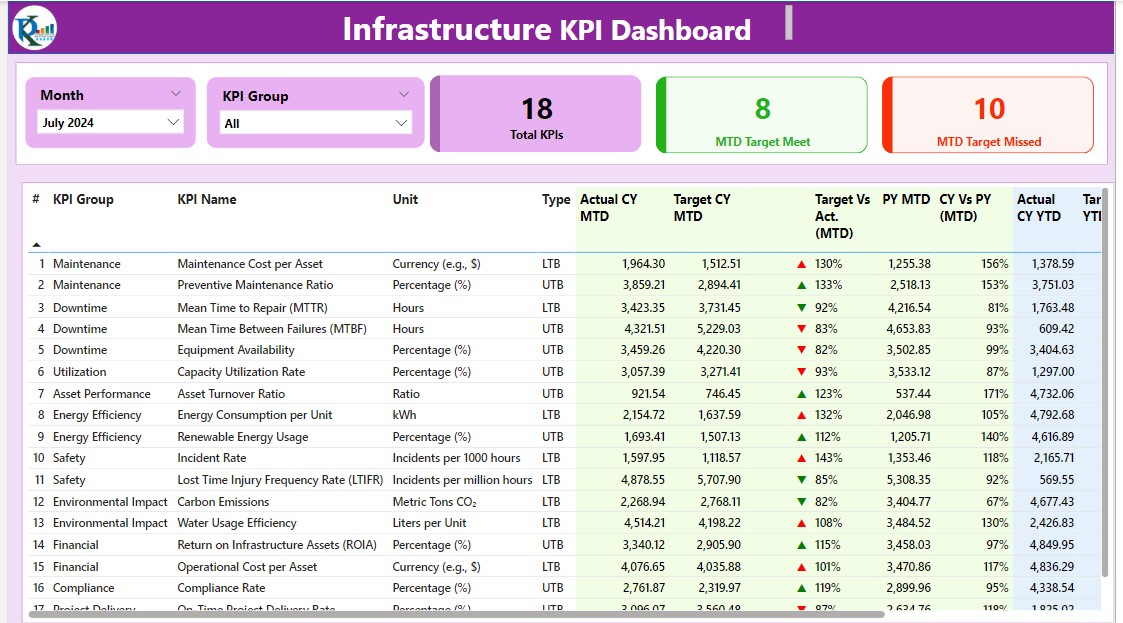
- Dynamic Slicers: Easily filter by Month and KPI Group to tailor the data display.
- Performance Cards: View the Total KPI count, Month-to-Date (MTD) Target Met, and MTD Target Missed counts at a glance.
- Detailed KPI Metrics Table: Includes essential metrics such as KPI Number, Group, Name, Unit, Type (LTB or UTB), Actual and Target comparisons for CY MTD/YTD, and visual indicators (▼, ▲) for performance status.
KPI Trend Page: In-Depth Trend Analysis
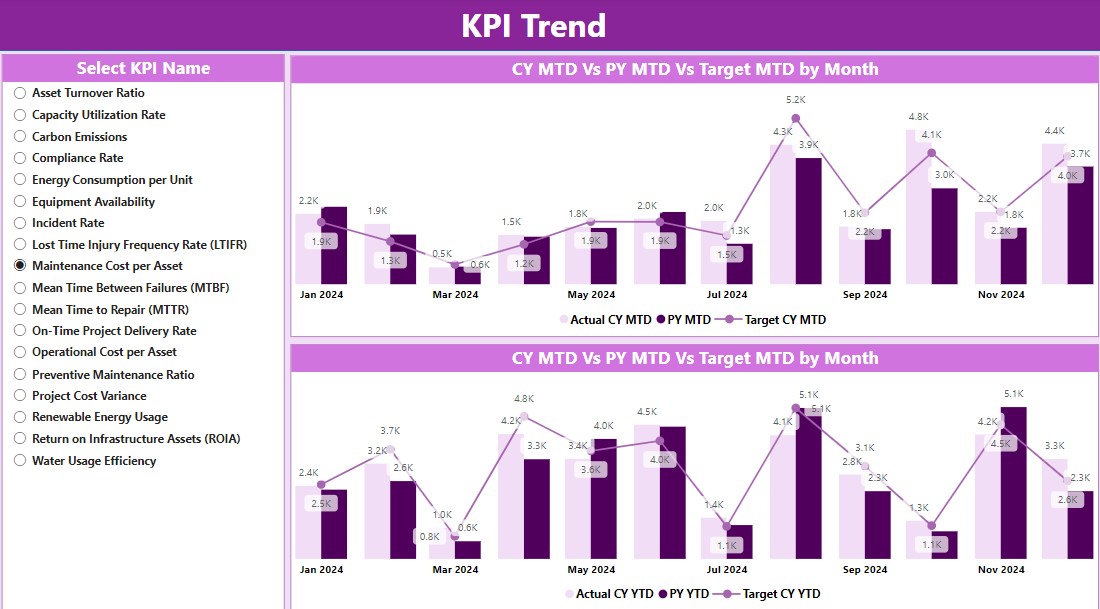
- Dual Combo Charts: Compare Actual Numbers, Targets, and Previous Year figures for both MTD and YTD.
- KPI Selector: Use slicers to select and view specific KPI trends, enhancing the analytical depth.
KPI Definition Page: Detailed KPI Insights
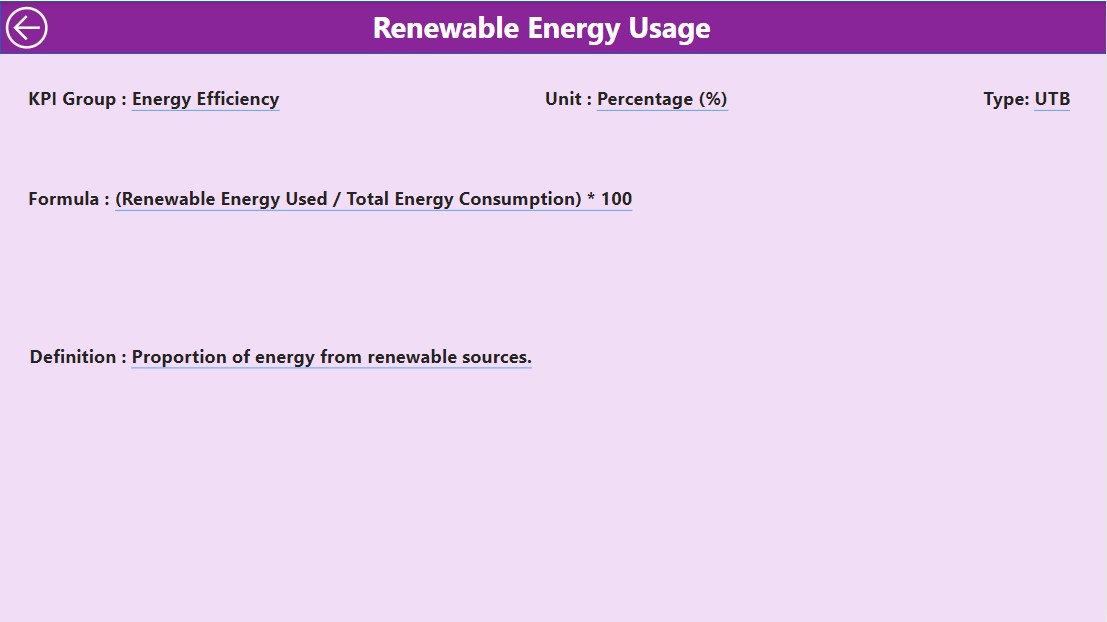
- Drill-Through Capability: Access hidden pages for detailed definitions and formulas of each KPI, enabling a deeper understanding and accurate analysis.
Excel Data Integration
Three Key Worksheets:
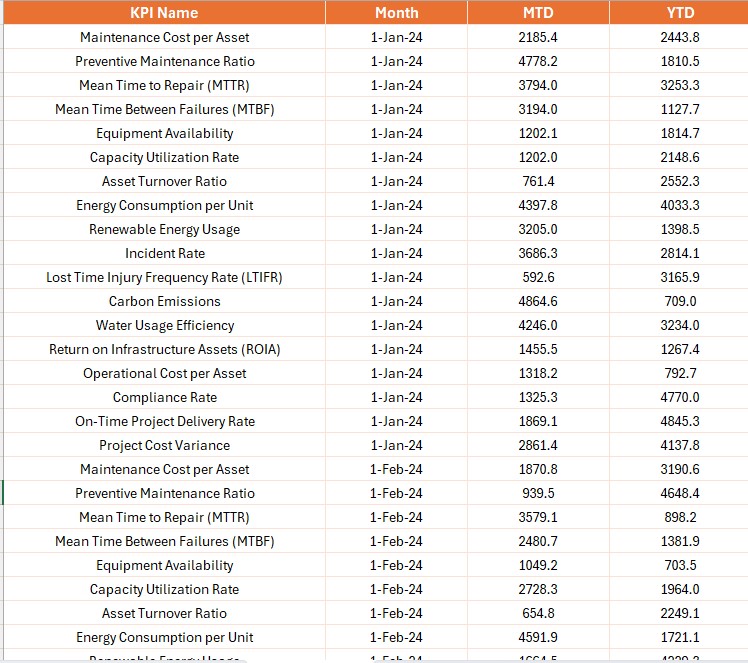
Input Actual Sheet:
- Enter actual numbers for each KPI, including dates, MTD, and YTD figures.
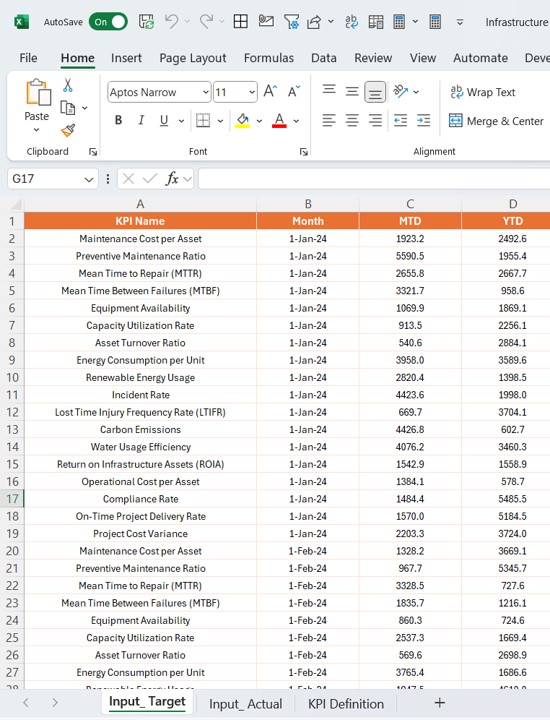
Input Target Sheet:
- Input target figures corresponding to the actuals to maintain performance evaluations.
KPI Definition Sheet:
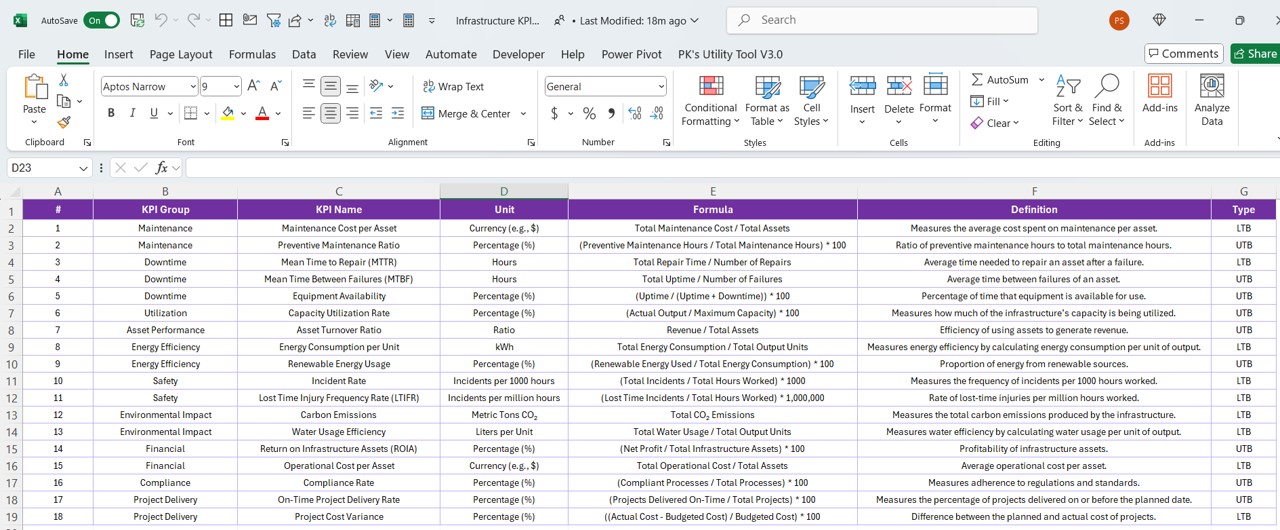
- Detail out KPI specifics like Number, Group, Name, Unit, Formula, Definition, and Type for clarity and consistency.