Unlock the potential of your international trade operations with our comprehensive International Trade KPI Dashboard in Excel. This meticulously designed, ready-to-use template allows you to monitor, analyze, and optimize your trade activities efficiently, ensuring you stay ahead in the global market.
Key Features:
Home Sheet:
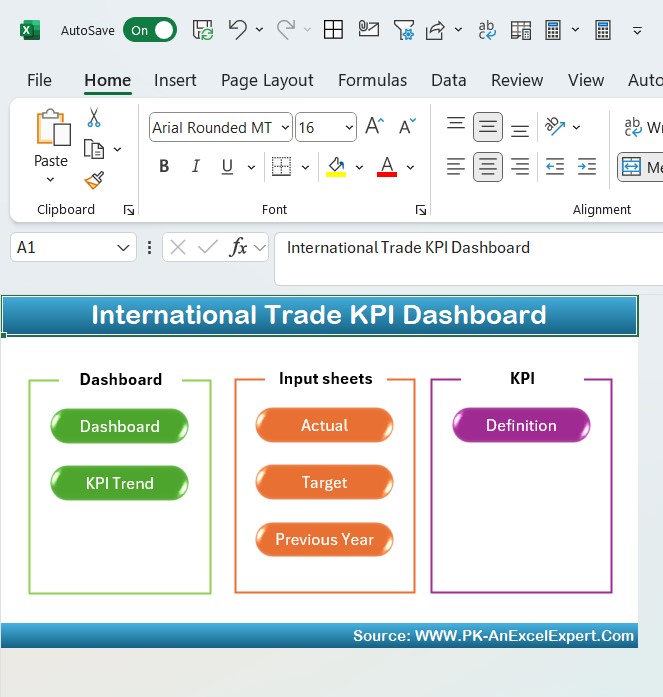
- An intuitive index sheet equipped with six buttons for quick navigation across various data sheets.
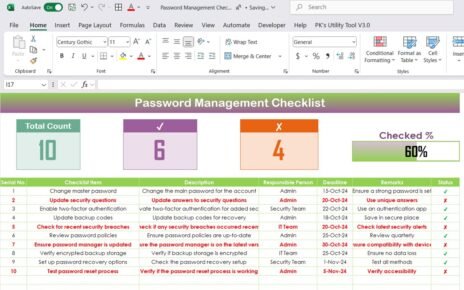
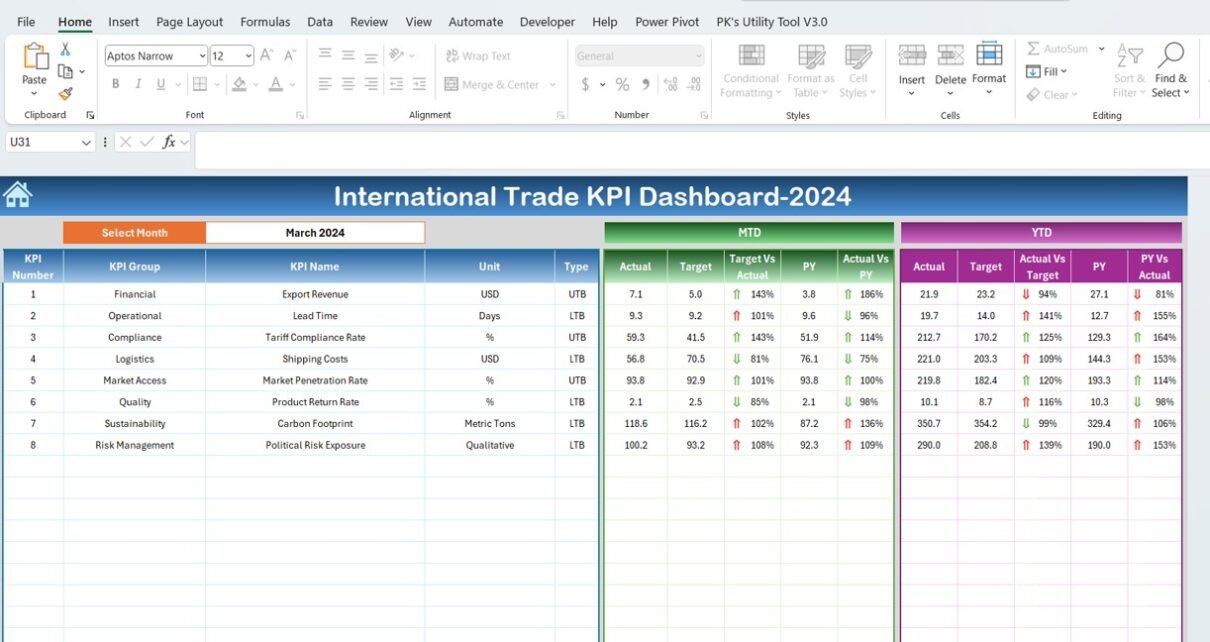
Dashboard Sheet:
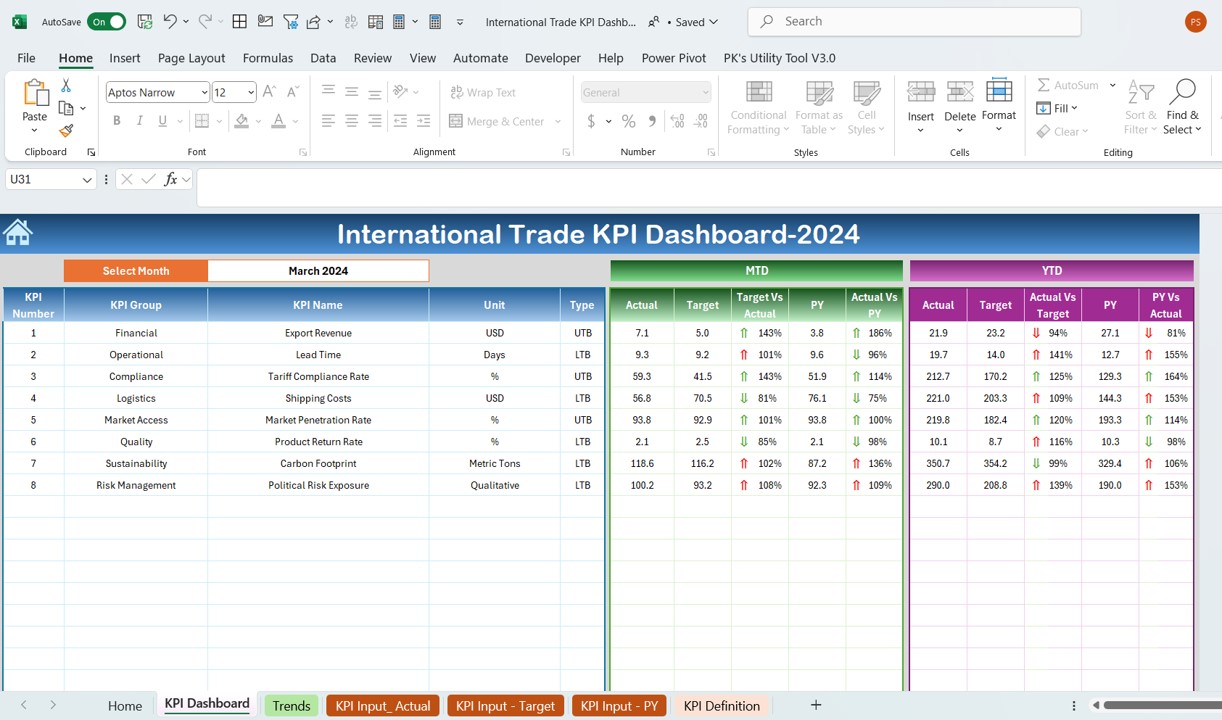
- The central hub of the dashboard displays all KPIs, allowing selections by month from a dropdown menu, updating all data dynamically to reflect MTD and YTD actuals, targets, and previous year statistics, enhanced with visual up and down arrows for quick analysis.
KPI Trend Sheet:
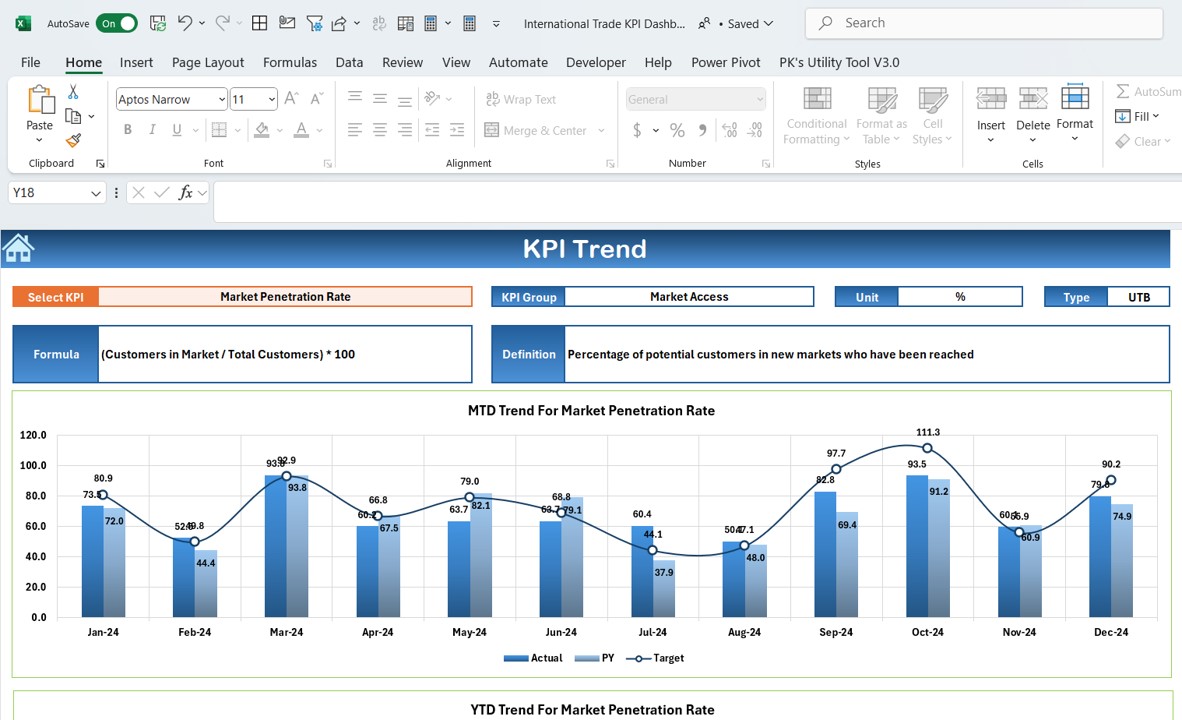
- Choose KPIs via a dropdown, displaying detailed trends and definitions, alongside MTD and YTD trend charts for a comprehensive performance overview.
Actual Numbers Input Sheet:
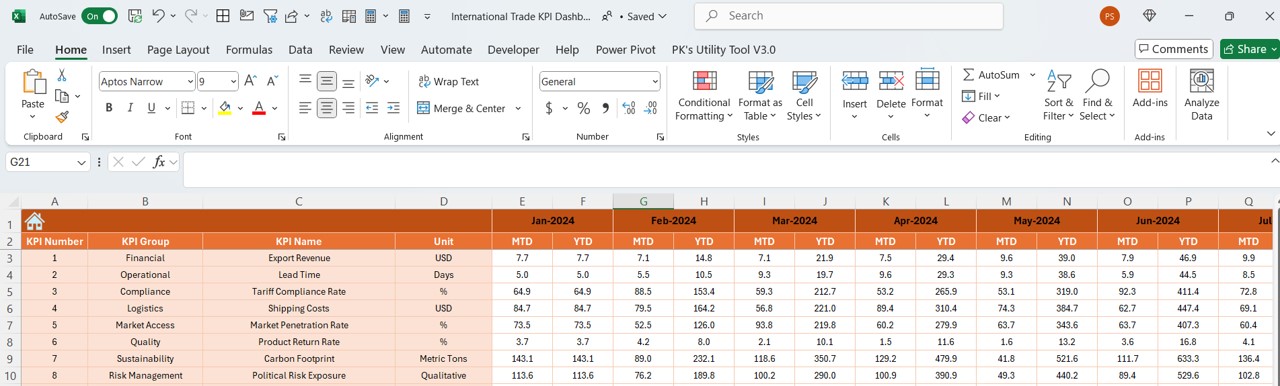
- Enter actual MTD and YTD numbers easily; adjust data entry by month to reflect timely statistics.
Target Sheet:
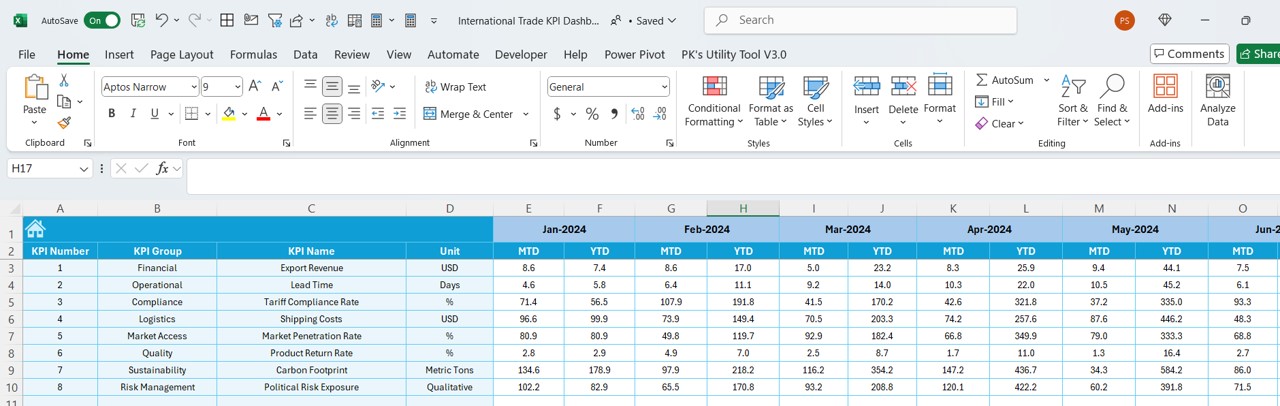
- Set monthly and yearly targets for each KPI, streamlining your goal-setting processes.
Previous Year Numbers Sheet:
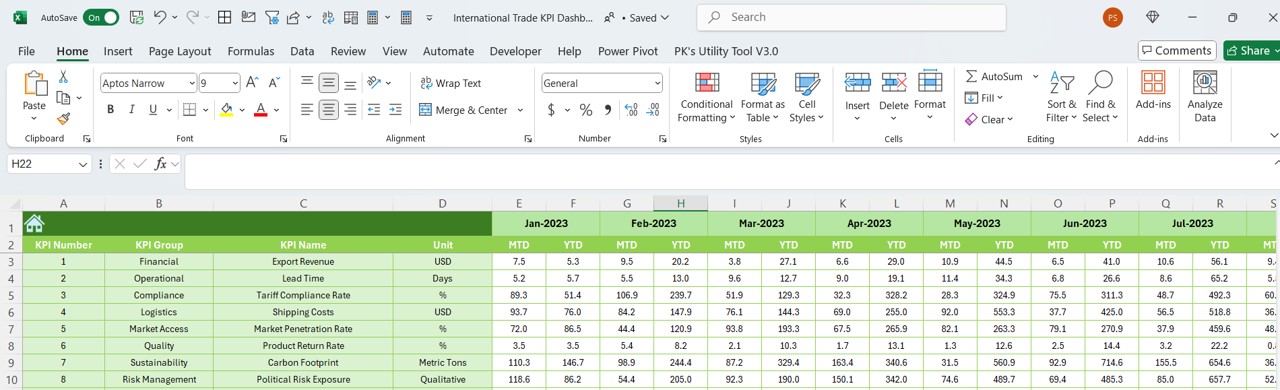
- Input last year’s data for year-over-year performance comparisons.
KPI Definition Sheet:
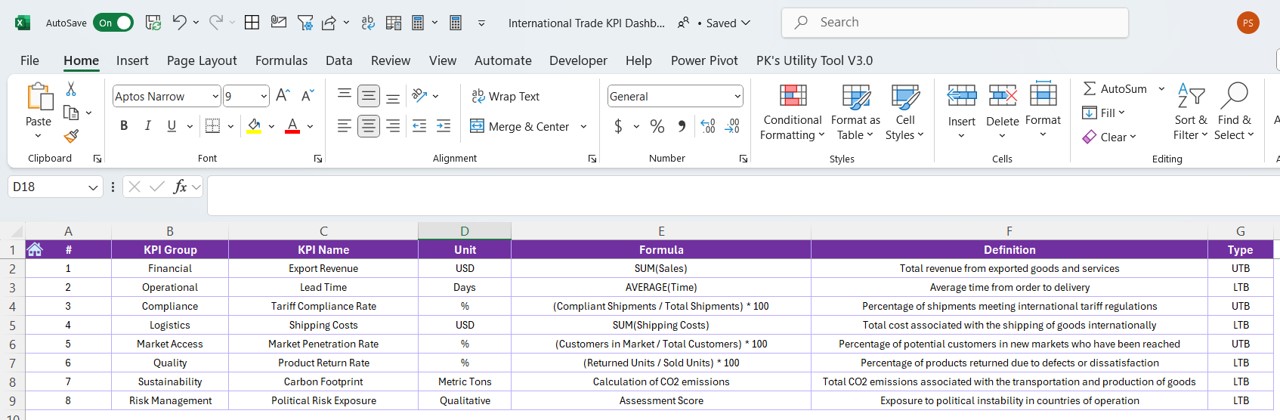
- Document and reference KPI names, groups, units, formulas, and detailed definitions for clarity and consistency.