Managing investor relations effectively requires accurate tracking and reporting of key financial metrics. Our Investor Relations KPI Dashboard in Excel is a ready-to-use template designed to help businesses track essential KPIs, analyze trends, and ensure transparent communication with investors. This professionally designed dashboard provides automated calculations, real-time comparisons, and visually appealing insights to make informed investment decisions.
Key Features of the Investor Relations KPI Dashboard
Home Sheet
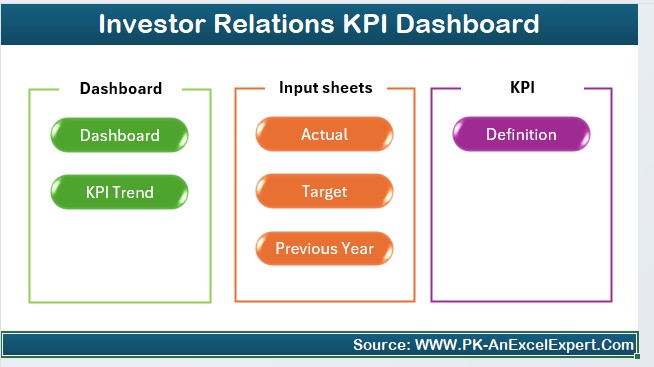
An intuitive index page with 6 quick-access buttons for seamless navigation across different sections.
Dashboard Sheet
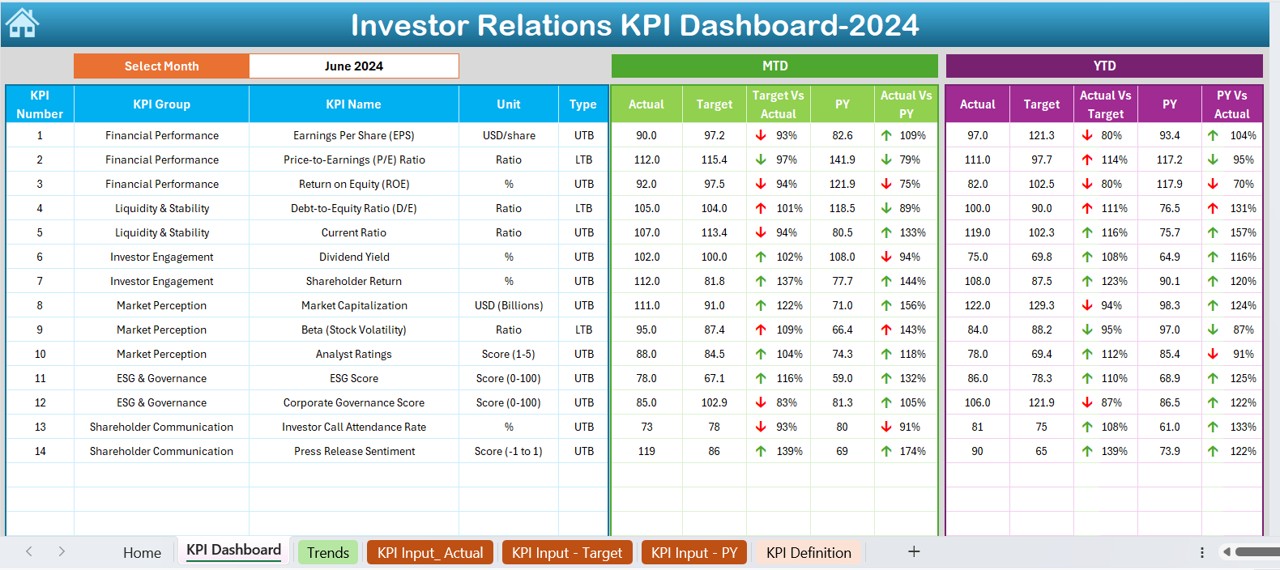
Displays a comprehensive overview of KPIs with:
- MTD & YTD Actual, Target, and Previous Year data
- Performance trend indicators with up/down arrows
- Drop-down selection for month-wise analysis
KPI Trend Sheet
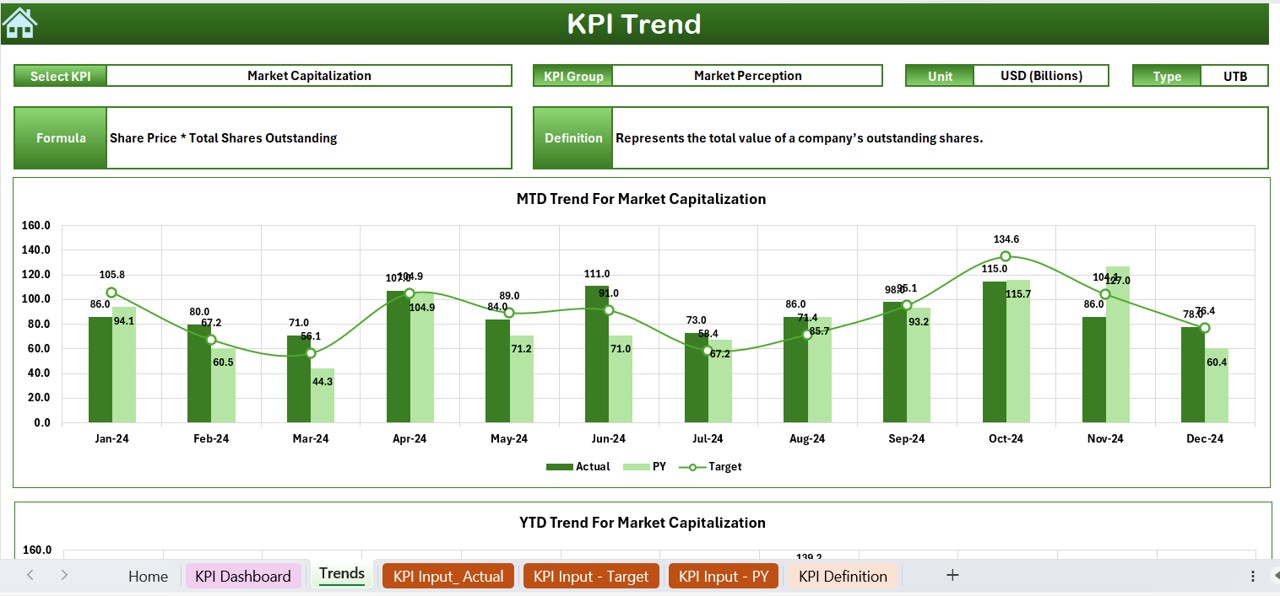
Select a KPI from a drop-down and view:
- KPI Group, Unit, Type (Lower or Upper Better), Formula, and Definition
- MTD and YTD trend charts for deeper insights
Actual Numbers Input Sheet
Manually enter actual data for MTD and YTD, with an automated date selection feature.
Target Sheet
Set monthly and yearly target values for each KPI to compare actual vs. expected performance.
Previous Year Number Sheet
Enter historical data for year-over-year comparisons and performance tracking.
KPI Definition Sheet
Maintain a structured list of KPI names, groups, formulas, and definitions for consistency.