The Lead Nurturing KPI Dashboard in Excel is a powerful and ready-to-use template designed to help businesses track and optimize their lead nurturing efforts. With an interactive dashboard and automated calculations, this tool enables users to analyze key performance indicators (KPIs), compare trends, and make data-driven decisions effortlessly.
Key Features
Interactive Home Sheet:
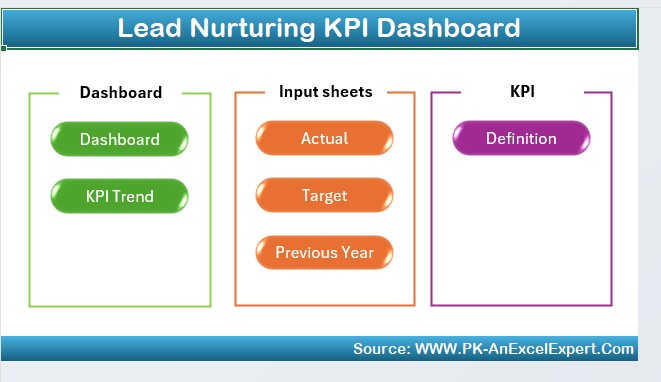
Navigate easily with quick-access buttons to different sheets.
Dynamic Dashboard:

View MTD and YTD Actual vs. Target vs. Previous Year data with real-time updates.
KPI Trend Analysis:
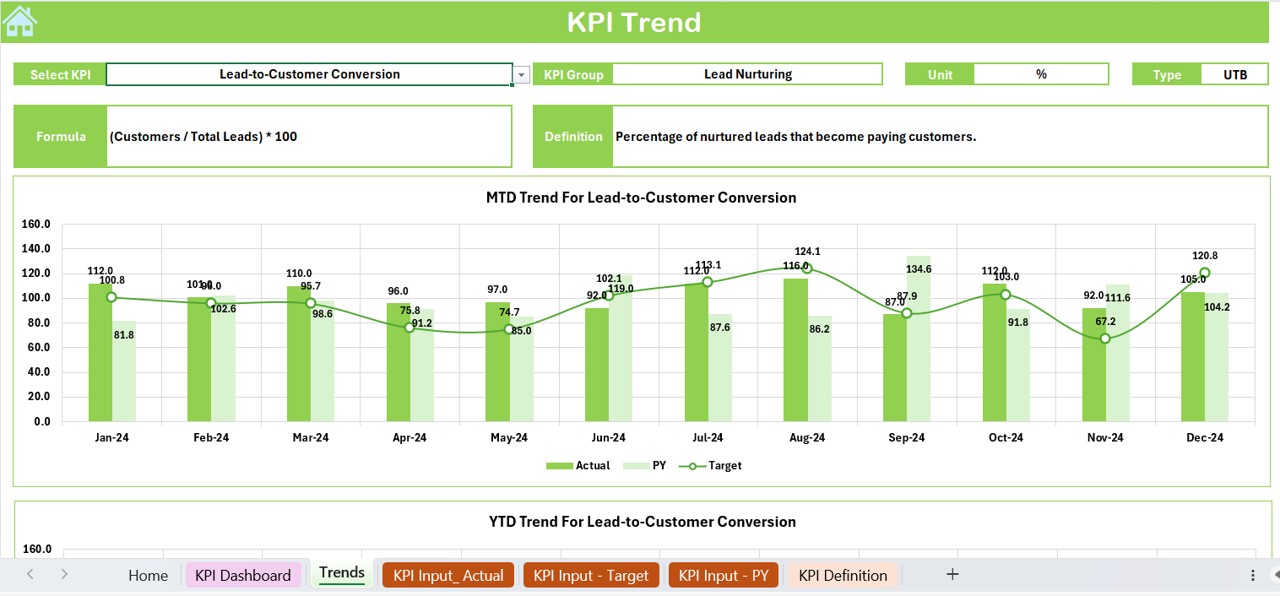
Track KPI performance trends with an intuitive drop-down selection and graphical representation.
Actual Numbers Input:
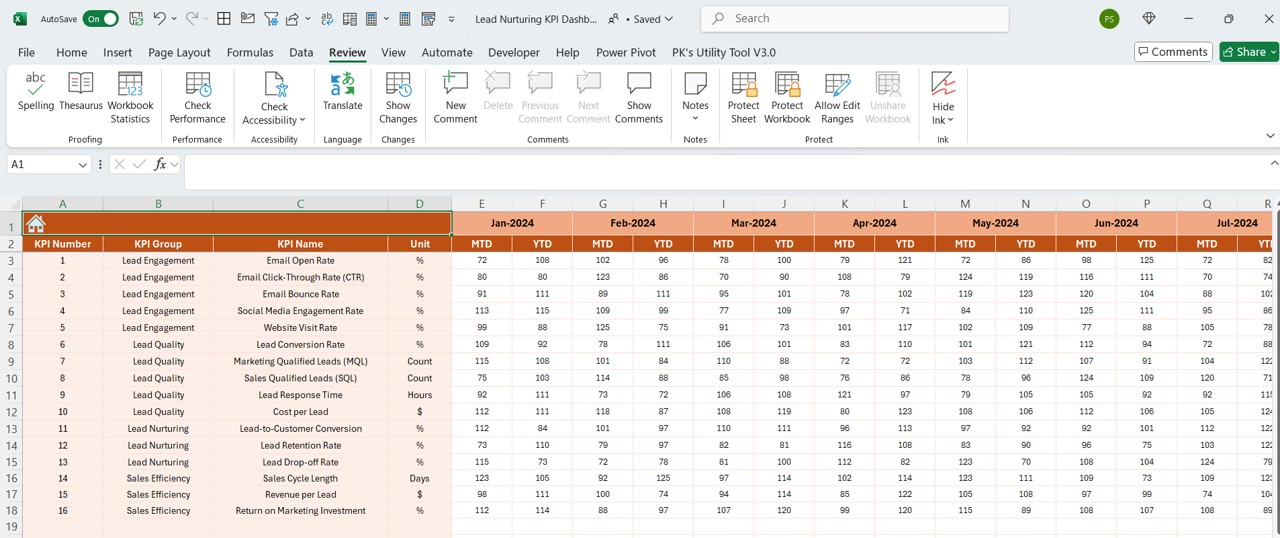
Seamlessly input actual MTD and YTD figures for comprehensive tracking.
Target & Historical Data Management:
Store and compare KPI targets and previous year’s performance.
KPI Definition Sheet:
Maintain a structured approach with KPI names, formulas, and definitions for clarity.