Managing a loan portfolio efficiently requires tracking key performance indicators (KPIs) in real-time. Our Loan Portfolio KPI Dashboard in Excel is a ready-to-use, fully automated solution designed for financial institutions, lenders, and portfolio managers. It enables users to monitor loan trends, analyze performance, and make data-driven decisions with ease.
Key Features of the Loan Portfolio KPI Dashboard
Home Sheet:
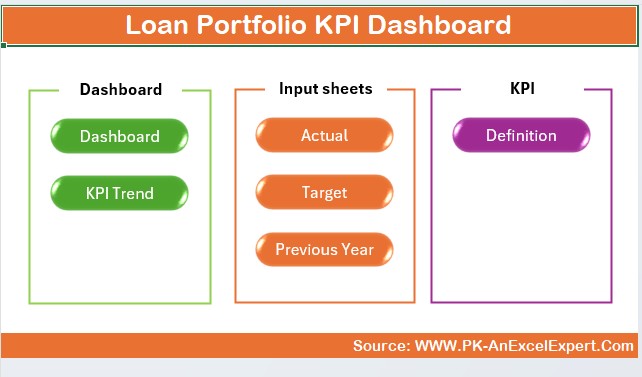
Acts as an index page with quick navigation buttons for seamless access to different sections.
Dashboard Sheet:
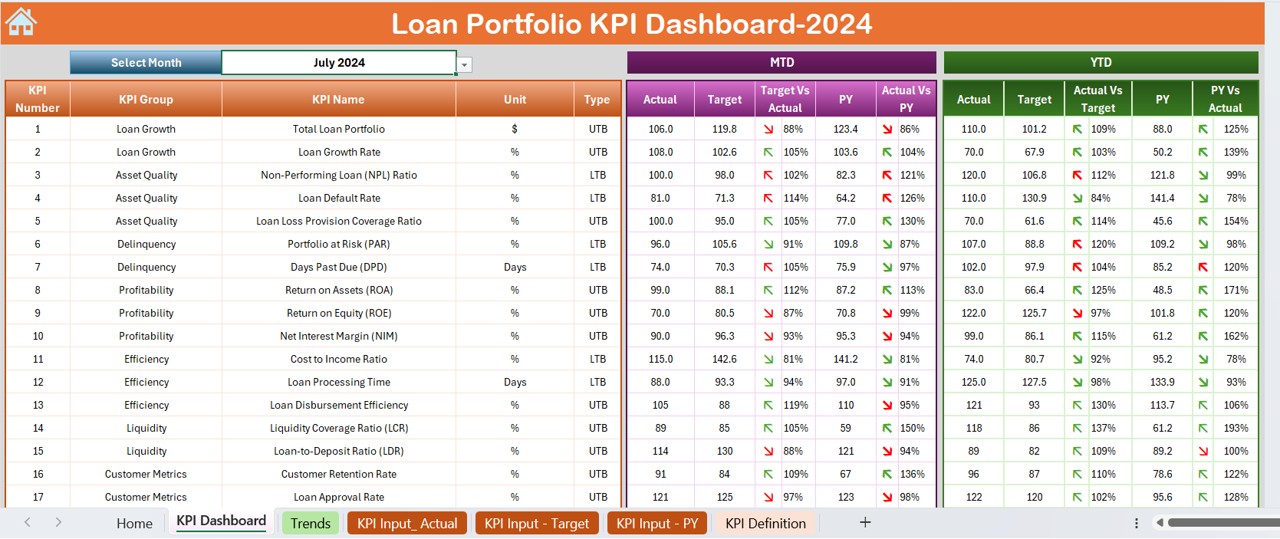
Provides a comprehensive view of all KPIs, including MTD and YTD actuals, targets, and previous year comparisons. Dynamic drop-downs allow month selection, with auto-updating figures and conditional formatting.
KPI Trend Sheet:
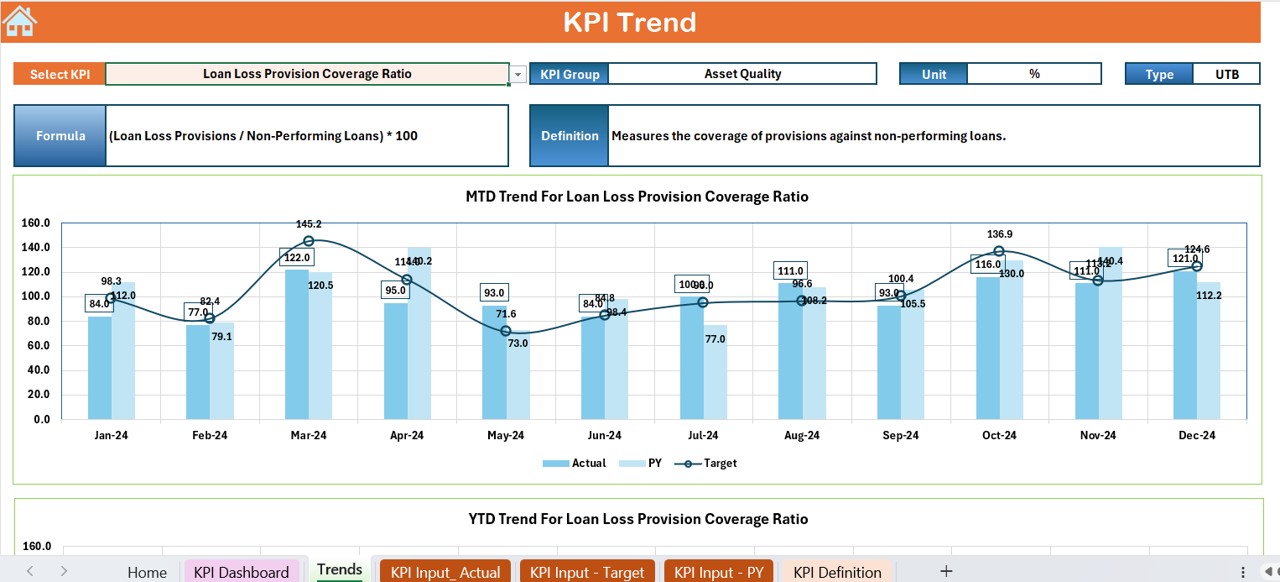
Allows selection of individual KPIs to view their definitions, formulas, and performance trends through interactive MTD and YTD charts.
Actual Numbers Input Sheet:
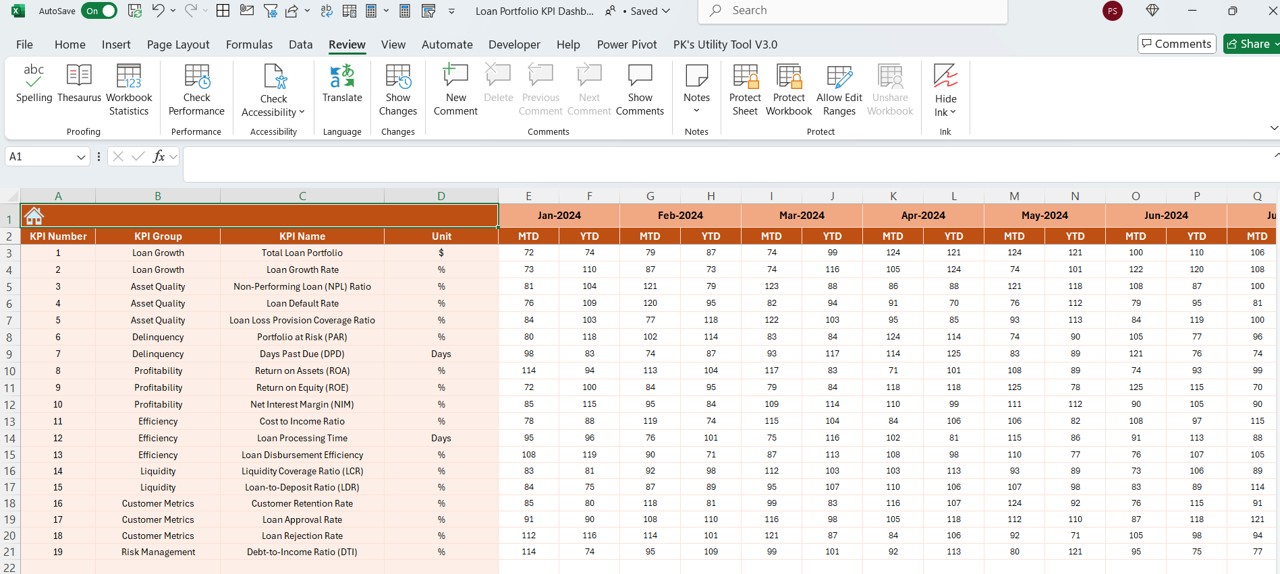
Simplifies manual data entry for MTD and YTD figures, with the option to change the reporting month dynamically.
Target Sheet:
Users can define monthly KPI targets for better benchmarking and performance comparison.
Previous Year Numbers Sheet:
Stores historical data to facilitate easy year-over-year analysis.
KPI Definition Sheet:
Maintains a structured database of all KPIs, including group classifications, measurement units, and formulas.