The Medical Research KPI Dashboard in Excel is a comprehensive tool designed to streamline the tracking and analysis of key performance indicators (KPIs) across various research activities. This dashboard is specifically created to help researchers, institutions, and stakeholders monitor the progress of clinical trials, drug development, patient engagement, and more, ensuring that important research goals are met efficiently and effectively.
Key Features of the Medical Research KPI Dashboard
- Home Sheet: Serves as the index sheet, featuring six navigation buttons for easy access to different sections of the dashboard.

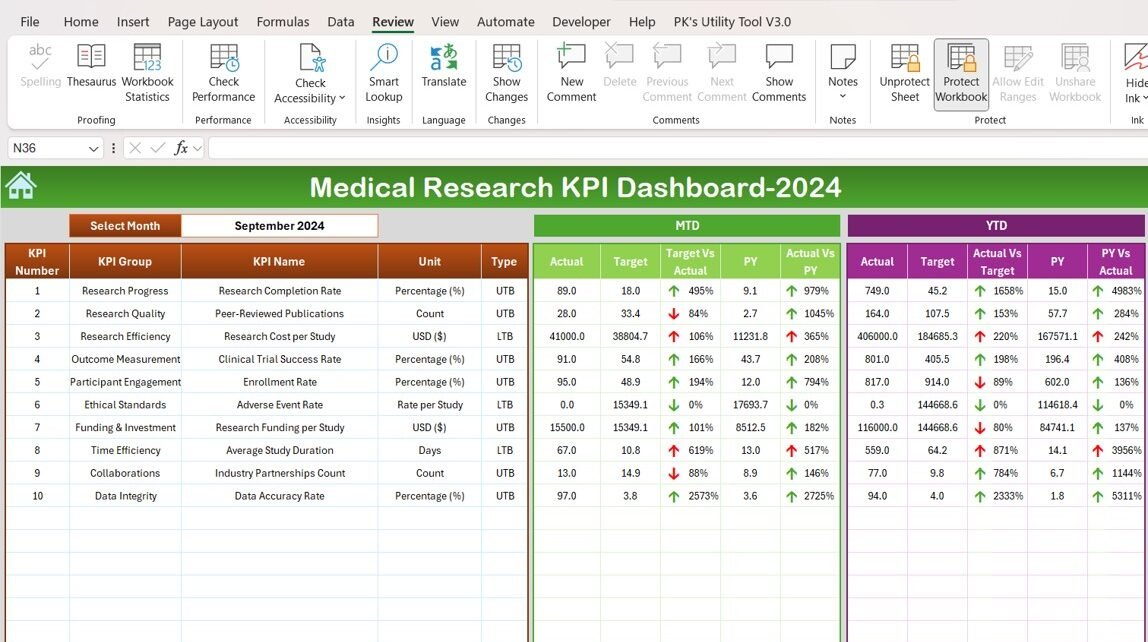
- Dashboard Sheet Tab: Displays all KPIs and allows you to select a specific month. The dashboard automatically updates to reflect MTD (Month-to-Date) and YTD (Year-to-Date) actual data, target values, and comparisons with previous year data, using clear visual indicators such as up/down arrows.

- KPI Trend Sheet Tab: This tab lets you choose a KPI and view its specific details, such as the KPI group, unit of measurement, whether the KPI is “lower the better” or “upper the better,” and the KPI formula and definition.

- Actual Number Sheet Tab: Enter actual performance data for each KPI, updating the dashboard for MTD and YTD based on the selected month.
- Target Sheet Tab: Input target values for each KPI, both for MTD and YTD, to compare with actual results and track research progress against set goals.
- Previous Year Data Sheet Tab: Track and compare previous year data to measure progress and identify trends over time.
- KPI Definition Sheet Tab: A reference sheet that includes definitions, units, formulas, and more for each KPI to ensure clarity and consistency in tracking.