The Microfinance KPI Dashboard in Excel is a professionally designed, ready-to-use template tailored to monitor and evaluate the performance of microfinance institutions. This dashboard enables organizations to track essential KPIs efficiently, providing valuable insights to enhance decision-making and improve operational outcomes.
Key Features of the Microfinance KPI Dashboard
Home Sheet:
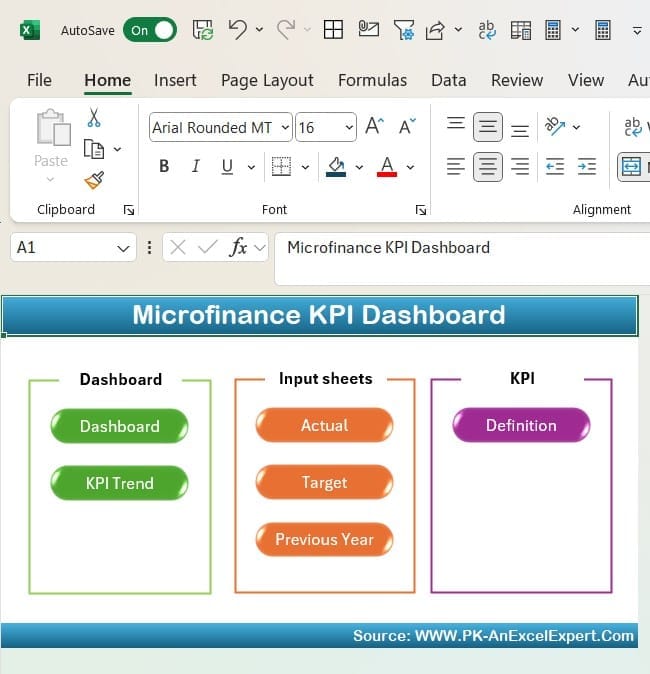
- A user-friendly index with six navigation buttons for quick access to the dashboard’s main sections.
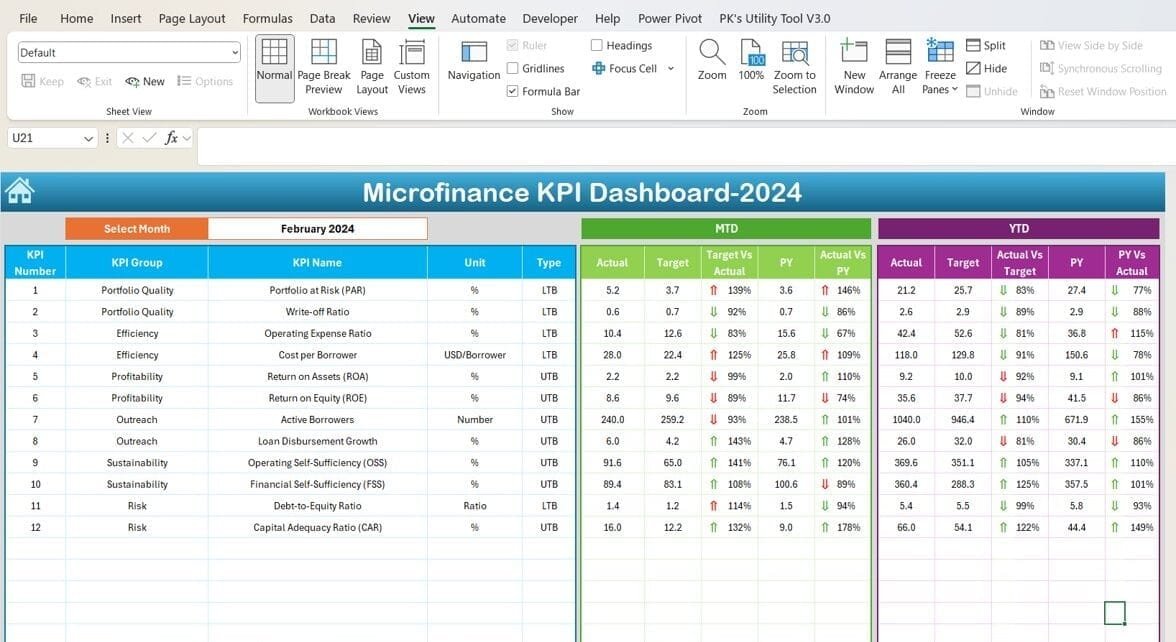
Dashboard Sheet Tab:
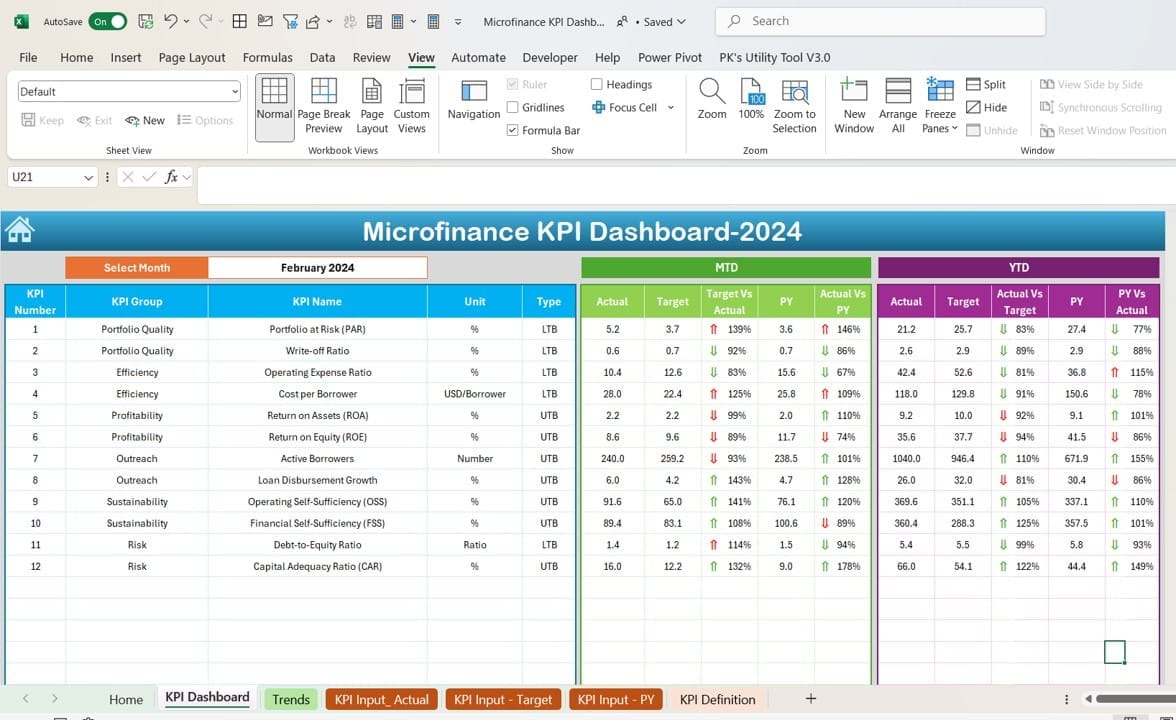
- Dynamic month selection with automatic data updates.
- Displays MTD (Month-to-Date) and YTD (Year-to-Date) performance metrics, including Actuals, Targets, and Previous Year data.
- Features visual indicators like up/down arrows for quick trend analysis.
KPI Trend Sheet Tab:
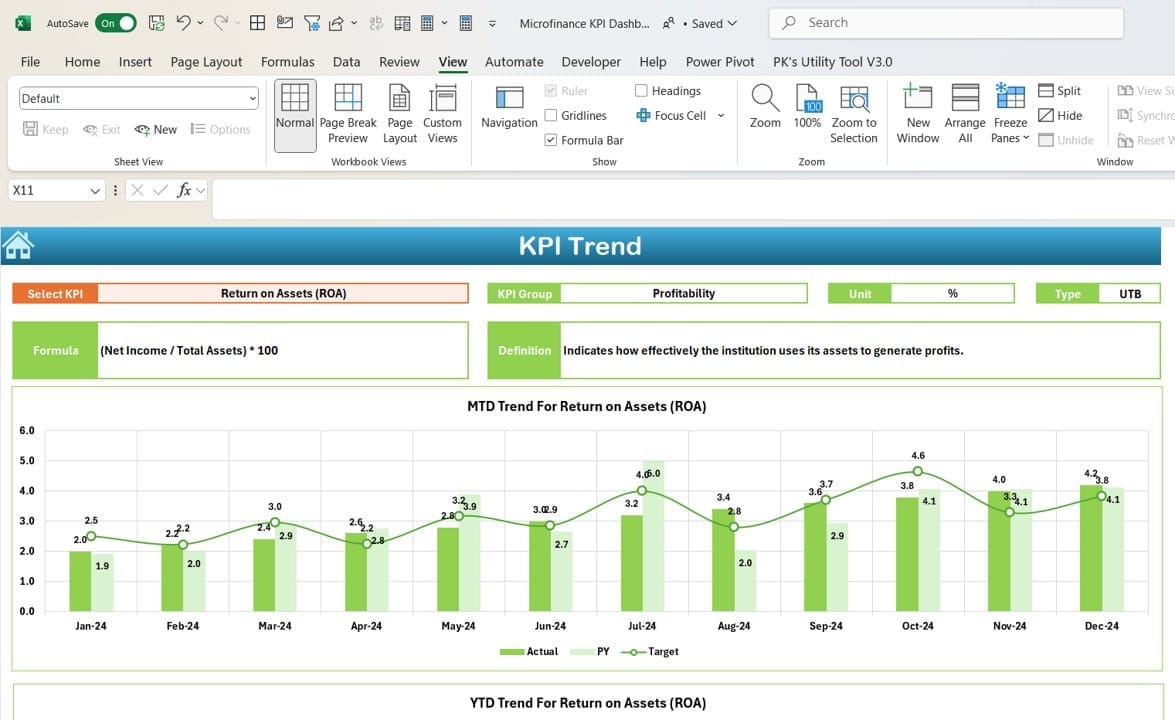
- Dropdown for selecting specific KPIs.
- Provides detailed KPI information, including Group, Unit, Formula, and Type (e.g., “Lower is Better” or “Upper is Better”).
- Includes trend charts for MTD and YTD metrics.
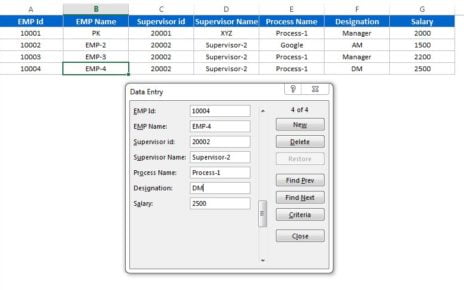
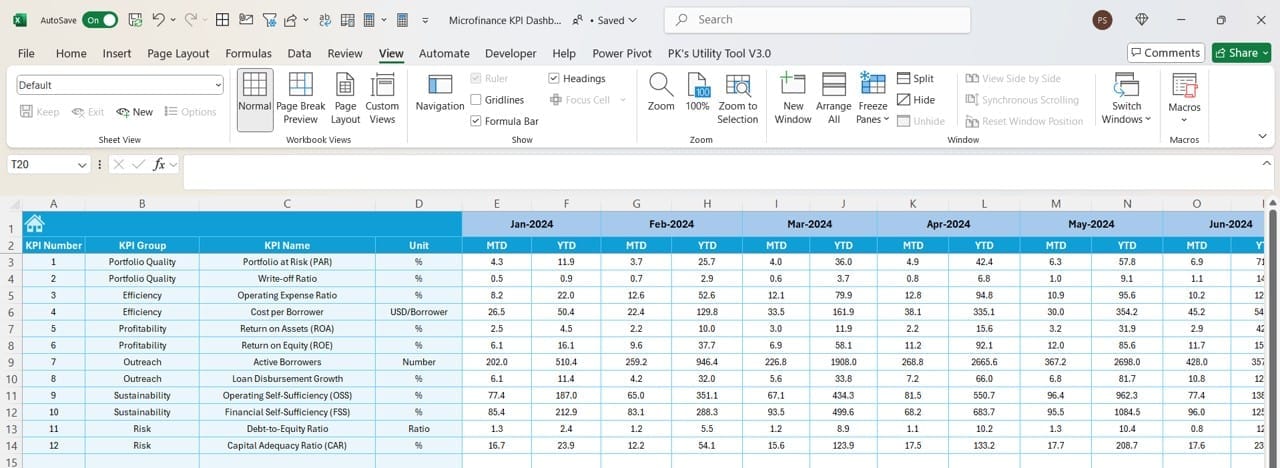
Actual Numbers Input Sheet:
- Simplifies data entry for MTD and YTD actual values with an adjustable fiscal start month.
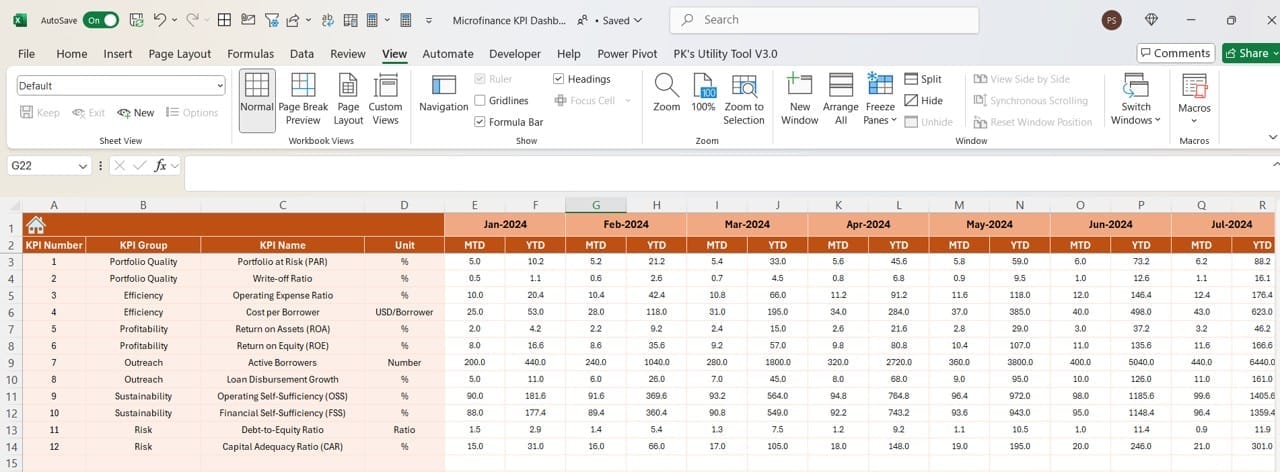
Target Sheet Tab:
- Input monthly and cumulative target numbers for each KPI.
Previous Year Numbers Sheet Tab:
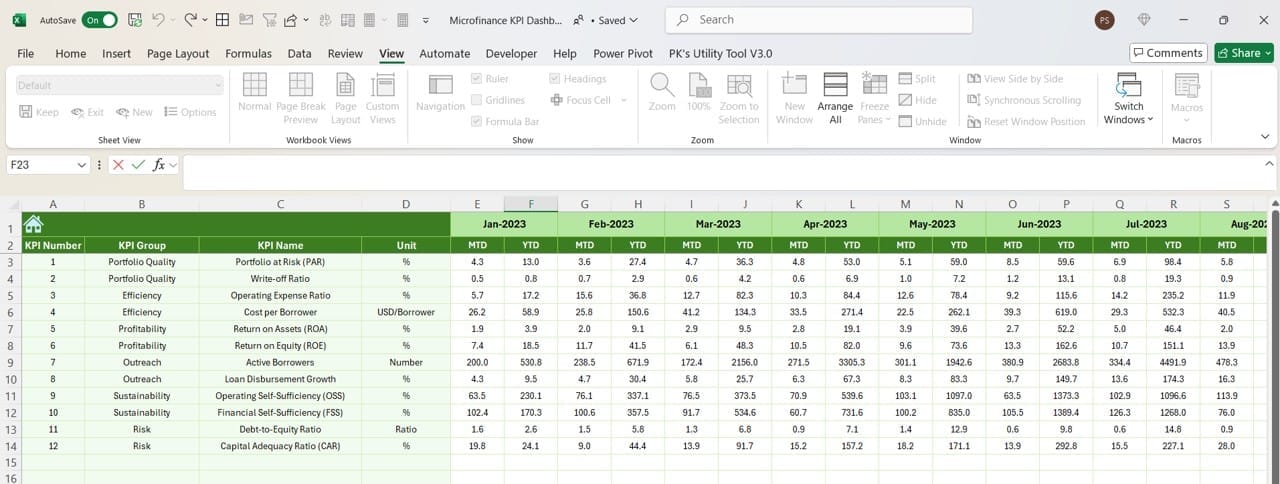
- Facilitates year-over-year comparisons by storing historical data.
KPI Definition Sheet Tab:
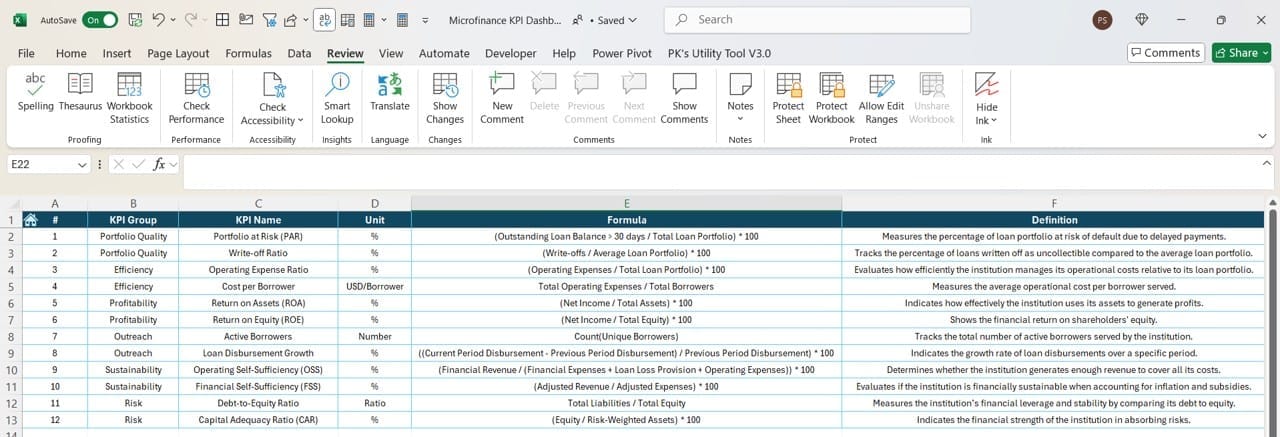
- Central repository for defining KPIs, including their group, formula, and detailed descriptions.